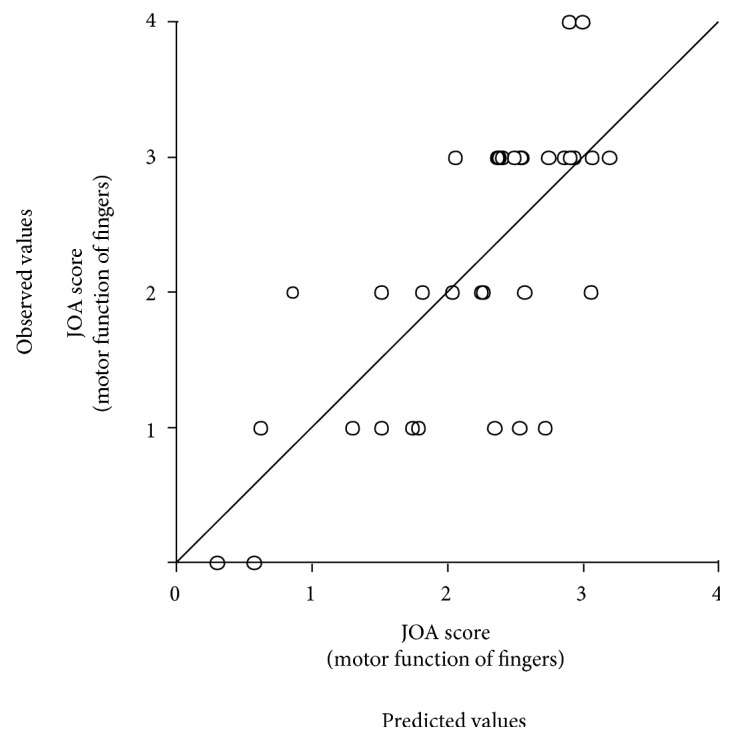
Figure 5.

A scatter plot regarding the JOA score (motor function of fingers: normal = 4) between predicted values according to a multiple regression analysis (abscissa) and the observed values (ordinate). A diagonal line means an exact match between the two values.
