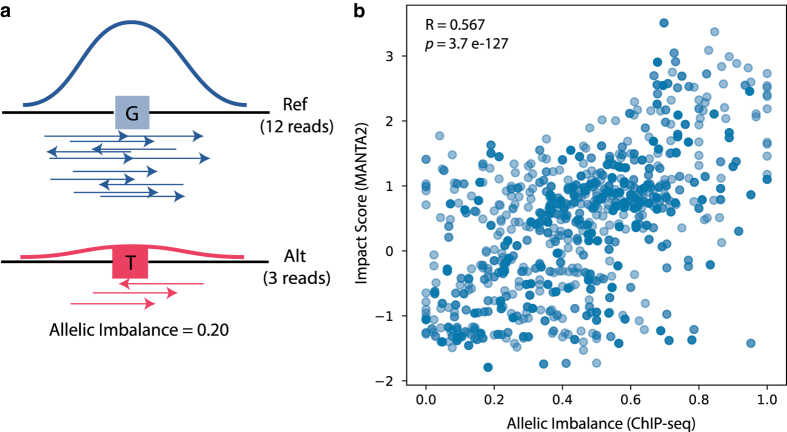
Figure 2. Assessing MANTA2 impact scores with heterozygous TF-binding events.
a) Allelic imbalance is calculated as the number of ChIP-seq reads mapped on the alternate allele divided by the total number of reads mapped at heterozygous sites. b) MANTA2 impact scores correlate with allelic imbalance of ChIP-seq data. Events (blue dots) are plotted with respect to their allelic imbalance of ChIP-seq reads (x-axis) and impact scores from MANTA2 (y-axis). The Pearson coefficient (R) and P-value (p) of the correlation between allelic imbalance and impact score are provided in the plot.

