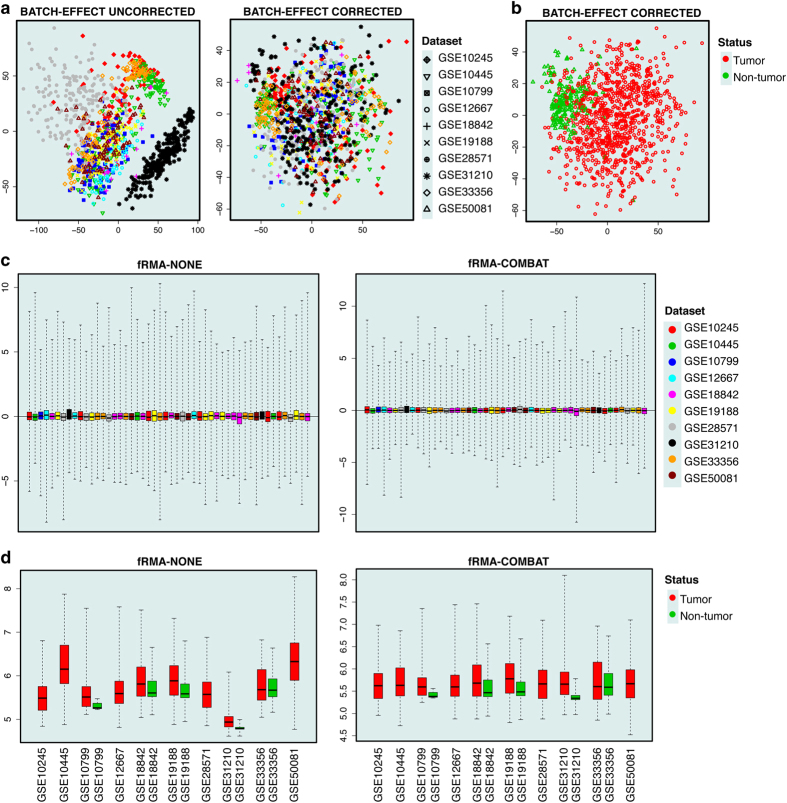
Figure 2. Validity of our generated dataset.
(a) The effect of batch effect removal is clearly demonstrated using the plotMDS function. (b) The MDS plot of our merged microarray dataset shows a clear separation between different disease phenotypes (925 primary NSCLC tumors: red; 193 non-tumors: green). (c) The merging effect of the ComBat technique on the fRMA-normalized data is illustrated using the plotRLE function. (d) The local effect of the ComBat method at the gene-level is demonstrated using the plotGeneWiseBoxPlot function. A1BG gene was selected for the demonstration purpose.

