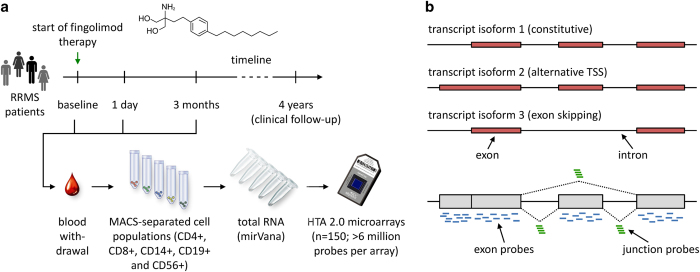
Figure 1. Study workflow and probe design of the transcriptome microarray.
(a) The main steps of data acquisition are presented. Peripheral blood was obtained longitudinally at 3 different time points: before the first dose of fingolimod, after ~24 h (before the second dose) and after 3 months of therapy. Five blood cell subsets were then each enriched by magnetic-activated cell sorting (MACS) from the blood samples of 10 patients, which were diagnosed with relapsing-remitting multiple sclerosis (RRMS). Finally, total RNA was isolated and used for the high-resolution gene expression analysis with 150 Affymetrix Human Transcriptome Arrays (HTA 2.0). (b) Illustration of the deep coverage of the transcriptome by HTA 2.0 microarrays (adapted from Xu et al.11). Shown is the exon-intron structure of a gene encoding 3 different transcript isoforms, which result from usage of an alternative transcription start site (TSS) and exon skipping during splicing. The accurate measurement of transcript abundance is realised by about 10 oligonucleotide probes (25mers) for each exon fragment and 4 probes for each exon-exon junction. In this case, the probe signal intensities can be summarised to either 7 exon-level probe sets or 1 gene-level probe set comprising all 52 probes mapping to the gene.

