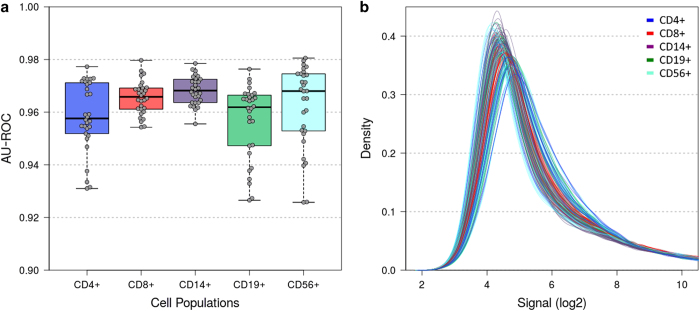
Figure 5. Consistency across samples with respect to data quality and data distribution.
(a) Analysis of positive and negative control probe sets for quality control. Box plot of parameter values calculated by the area under the curve of the receiver operating characteristic (AU-ROC). The boxes mark the medians and the upper and lower quartiles, and the whiskers extend to the most extreme values. All 150 microarrays showed high AU-ROC values >0.92. (b) Density plot displaying the distributions of gene-level probe set signal intensities after SST-RMA normalisation. None of the curves deviated markedly from the others, demonstrating comparable performance.

