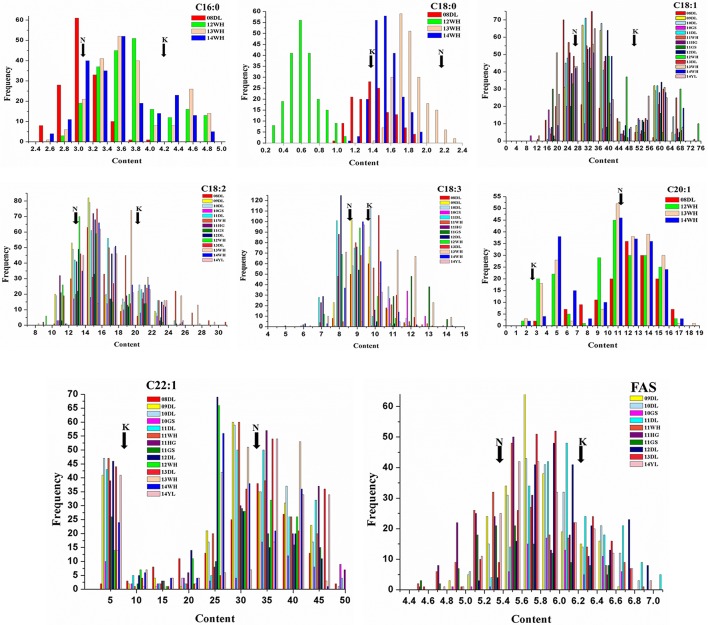
Figure 1.
Distribution of FA concentrations of KN DH population in multiple environments. The unit of x-axis represents the percentage of each FA composition in the sum of all FAs. The unit of y-axis represents the number of lines. K represents the male parent of “KenC-8” and N represents the female parent of “N53-2” of the KN-DH population.

