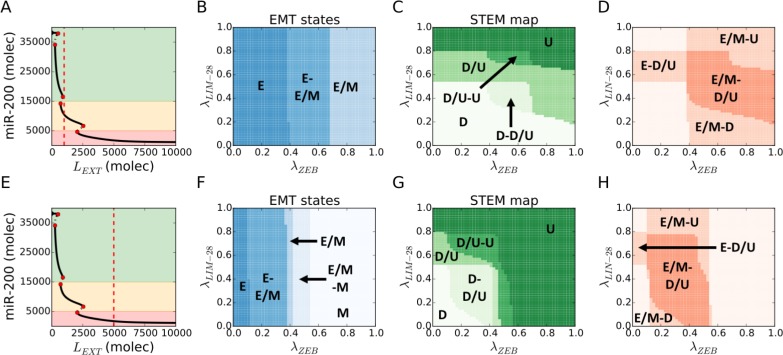
Figure 3. Hybrid E/M and D/U (stem-like) phenotypes overlap over a large variation of EMT-STEM circuit coupling strength.
(A) For LEXT = 103 molecules and no EMT-STEM coupling λLIM−28 = λZEM = 1 (first considered condition), the cell expresses a hybrid E/M state (see the intersection of the red dotted line with the diagram's continuous lines). (B) EMT state diagram over variation of fold-changes for let-7 inhibition on ZEB (λZEM, x-axis) and micro-RNA-200 inhibition on LIN-28 (λZEM−28, y-axis) and for LEXT = 103 (panel A). The cell phenotype is described by the state of the EMT module. (C) STEM phenotypic characterization diagram for the conditions of panel A. The cell phenotype is described by the state of the STEM module (Down: D, Stem: STEM, Up: U). (D) Superimposition of the stability regions of hybrid E/M state (panel B) and D/U state (panel C) for the conditions of panel A. Labels highlight the regions where the hybrid E/M and/or stem-like D/U are observed. This diagram does not label every combination of EMT and STEM phenotypes but only highlight regions where either hybrid E/M or stem-like D/U (or both) are expressed. (E) For LEXT = 5103 molecules and no EMT-STEM coupling λZEM−28 = λZEM = 1 (second considered condition), the cell expresses a monostable mesenchymal phenotype. (F) EMT state diagram for LEXT = 5103 (panel E). (G) STEM phenotypic characterization diagram for the conditions of panel E. (H) Superimposition of the stability regions of hybrid E/M state (panel F) and D/U state (panel G) for the conditions of panel E.

