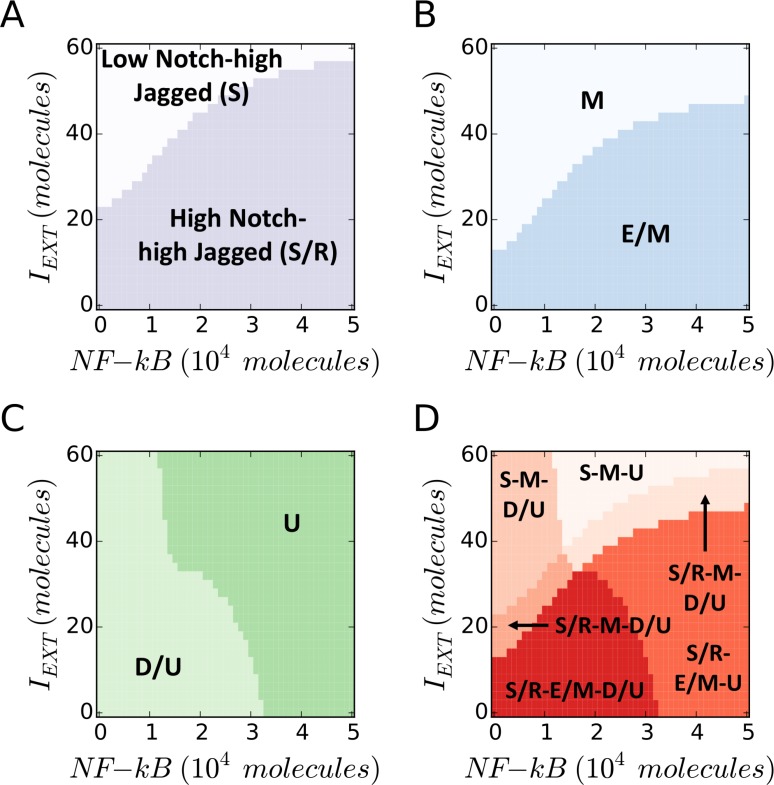
Figure 4. EMT Induction and NF-κB overexpression push cancer cells out of the “S/R-E/M-D/U window”.
(A) Phenotypic characterization diagram of the Notch phenotype in presence of variable NF-κB (x-axis) and EMT-Inducer IEXT (y-axis). A high IEXT pushes the cell out of the (high Notch, high Jagged) S/R phenotype, while NF-κB increases the IEXT threshold needed to exit the S/R phenotype. (B) State diagram of the EMT state. The cell transitions from hybrid (E/M) to mesenchymal (M) when IEXT is increased, while NF-κB increases the IEXT threshold required for the transition. (C) Phenotypic characterization diagram of the Stem phenotype. The cell switches from D/U – or STEM – to UP when NF-κB is increased, while IEXT decreases the NF-κB threshold required for the transition. (D) Overlap of the three maps highlights the S/R-E/M-D/U window. A large IEXT and/or overexpression of NF-κB pushes the cell out of the window. In this simulation, the cell phenotype is measured upon full equilibration. The initial condition is always within the S/R-E/M-D/U window. LEXT is constant at 2000 molecules and the EMT-STEM coupling is intermediate (λLIM−28 = λZEM−28 = 0.5).

