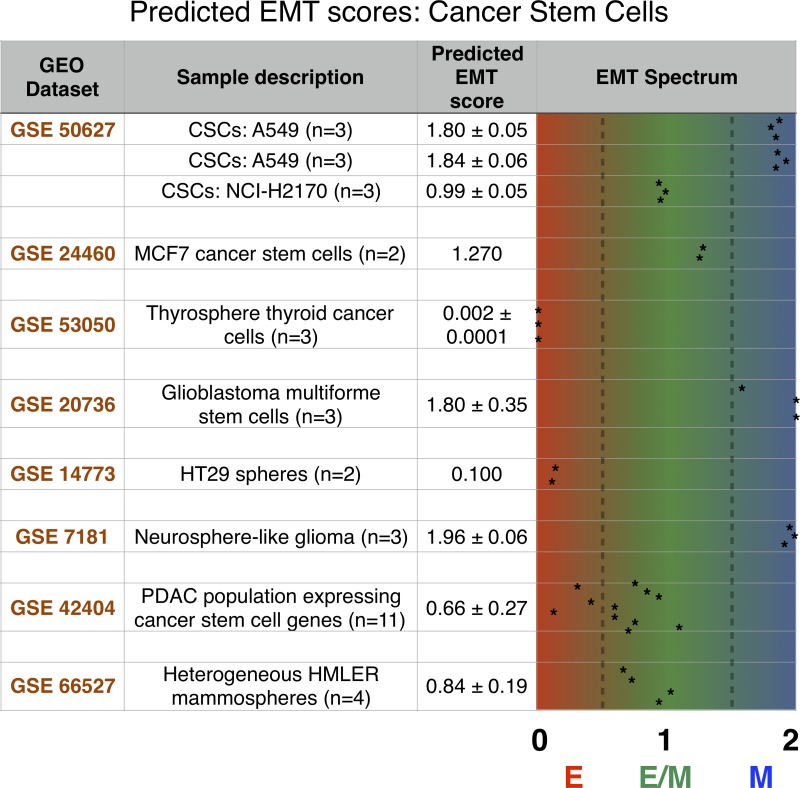
Figure 5. The predicted EMT score for several stem cancer subtypes shows a heterogeneous distribution across the EMT axis.
Each dataset is identified by its GEO number. The number of each sample in a given dataset along with a brief explanation is provided in sample description. Mean and, when applicable, standard deviation for relevant samples in each dataset are reported in the predicted EMT score category, and individual samples are graphed on the EMT spectrum to illustrate sample heterogeneity.

