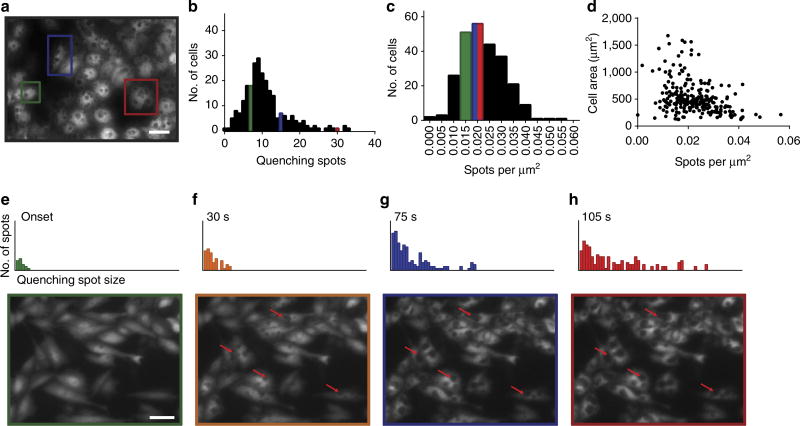
Figure 2. Quenching spots indicate sites of nanostraw penetration.
During Co2+ delivery, quenching spots grow in size as Co2+ accumulates above a penetrating nanostraw. Spots were counted (a, n = 252, scale bar, 25 µm) to determine the number of spots per cell (b), the density of spots per cell (c) and the dependence of spot density on cell area (d). The largest cells generally had more spots (red) than intermediate sized cells (blue) and small cells (green), but the actual density of spots was largely independent of cell area (c,d). The number of spots and their size increased (e–h, scale bar, 40 µm) as spots accumulated enough Co2+ to be observed.

