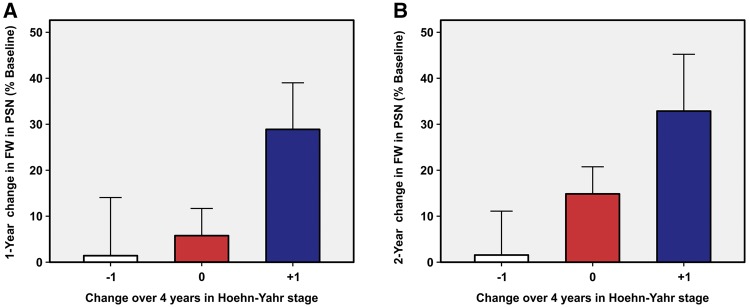
Figure 3.
Relative per cent change in free water in PSN over 1 year (A) and 2 years (B) across subgroups determined based on the 4-year changes in the Hoehn and Yahr stage. In both plots, the per cent change from baseline is greater in patients with Parkinson’s disease who had a 1-point increase on the Hoehn and Yahr scale (n = 8) than in patients with Parkinson’s disease who did not progress on the scale (n = 19). Parkinson’s disease patients who had a decrease of 1 point on the scale had almost no change in free water (n = 4) compared with the other two groups. Error bars represent the standard error. FW = free water; PD = Parkinson’s disease.

