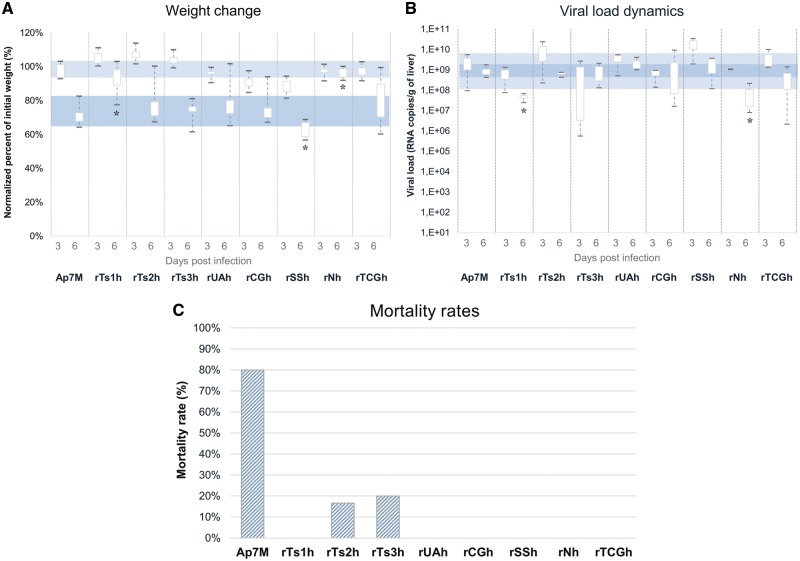
Figure 3.
In vivo phenotypes of Ap7M and Ap7M-derived re-encoded viruses. Normalised percentages of initial weight (%IW) (A), viral loads at 3/6 dpi (B), as well as mortality rates (C), are illustrated for all viruses. %IW were evaluated on groups of twelve and nine hamsters at 3 and 6 dpi, respectively. Viral loads were evaluated on groups of three and four hamsters at 3 and 6 dpi, respectively. Of note, for YFV rTs2h, only three hamsters were used for viral load determination at 6 dpi. Mortality rates were evaluated on groups of five hamsters for all viruses, apart from rTs2h, for which six hamsters were used. Computations of %IW and viral loads are detailed in the corresponding paragraphs within the ‘Section 4’. Significant %IW and viral load differences observed between Ap7M and the other viruses at 6 dpi (Wilcoxon rank-sum test P value <0.05) are indicated by a star (*). The ranges corresponding to viral load values recorded at 3 and 6 dpi during Ap7M infection are highlighted by light (3 dpi) and dark (6 dpi) blue rectangles.

