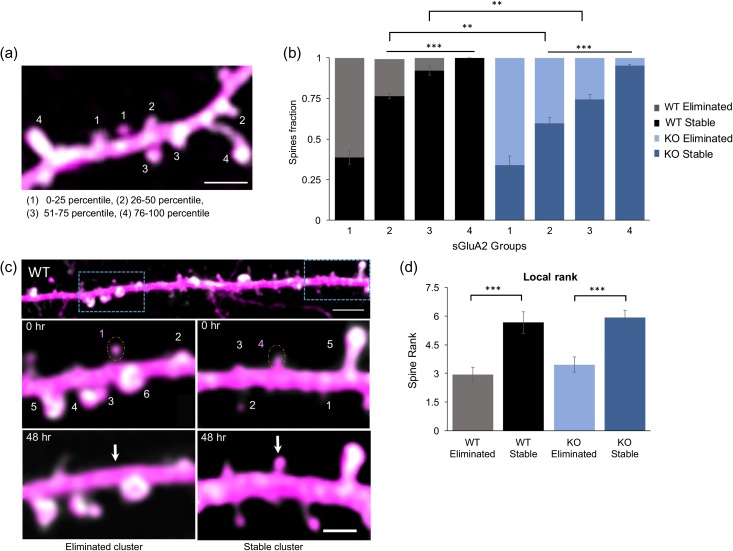
Figure 3.
sGluA2 levels predict spine fate. (a) A representative image of a dendritic branch with spines assigned to 1 of 4 groups based on increasing percentile rank of sGluA2 intensity. scale: 2.5 μm. (b) The fraction of stable spines (dark bars) and eliminated spines (light bars) was plotted per sGluA2 level groups in the WT and KO mice. For stable WT spines, 1: 0.38 ± 0.04, 2: 0.76 ± 0.018, 3: 0.92 ± 0.03 and 4: 1 ± 0, n = 4 mice. For stable KO spines, 1: 0.33 ± 0.05, 2: 0.59 ± 0.04, 3: 0.74 ± 0.03, and 4:0.95 ± 0.01, n = 5 mice. Repeated ANOVA analysis, *P < 0.5, **P < 0.01, ***P < 0.001. (c) sGluA2 spine rank within a local cluster determines spine fate. Top: A dendrite containing 2 clusters centered around spines with similar sGluA2 levels but opposing fates. Scale bar: 10 μm. Below: Magnified images of boxed areas. Numbers represent ranking of spines within a cluster, a 10 μm stretch centered around the target spine (dotted orange circle). The target spines had similar sGluA2 intensity but opposing fates. Note that their local ranking was different with the higher rank spine (right) persisting 48 h later while the spine with the lower rank (left) disappearing. Scale bar: 2.5 μm. (d) Mean local rank of similar sGluA2 containing spines was significantly higher in stable spines in both genotypes (WT: eliminated spines: 2.95 ± 0.36, stable spines: 5.66 ± 0.57, n = 34 spines; n = 30 spines, KO: eliminated spines: 3.46 ± 0.37, stable spines: 5.9 ± 0.39, n= 28 spines, n = 28 spines, Two-way ANOVA, ***P < 0.001). All data represented as mean ± SEM.

