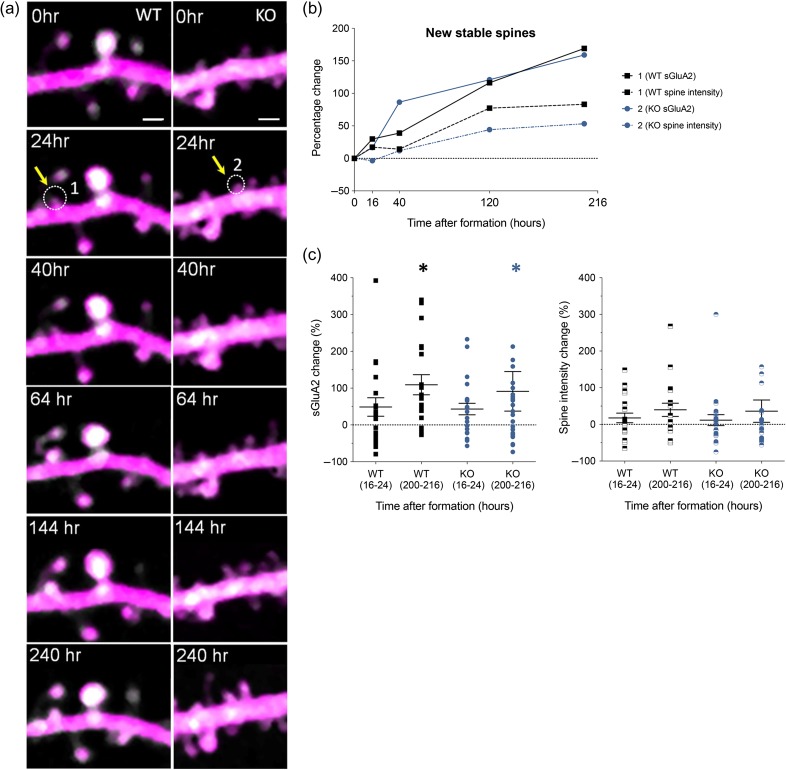
Figure 5.
Newly formed spines gradually accumulated sGluA2 over time. (a) Representative time-lapse 2PLSM images showing formation of new spine from WT and KO (marked in white dotted circle) in WT (spine 1) and KO (spine 2) with corresponding sGluA2 and spine intensity traces shown in (b). Scale bar: 1.5 μm. (c) sGluA2 and spine intensity changes in stable new spines (WT sGluA2: 16–24 h 48.71 ± 25.21%, 200–216 h 109 ± 27.31%, n = 19 spines, KO sGluA2: 16–24 h 43.19 ± 15.58%, 200–216 h 91.23 ± 53.81%, n = 22 spines, Two-way ANOVA with Bonferroni correction, *P < 0.5). Spine intensity change was not significant over time or across genotype (two-way ANOVA with Bonferroni correction). Data presented as mean ± SEM.

