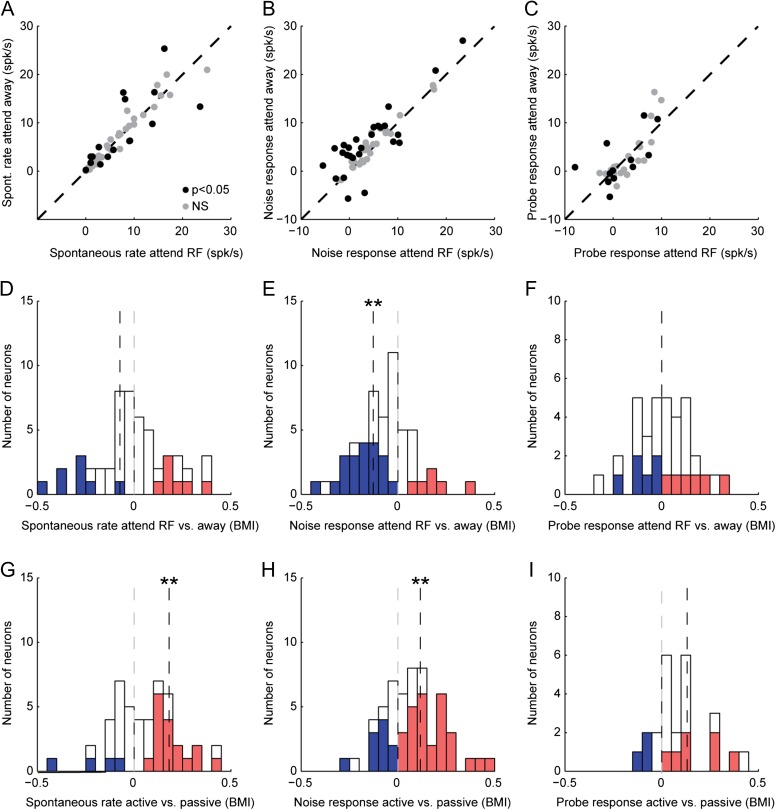
Figure 3.
Summary of selective attention and task engagement effects on A1 evoked activity. (A–C) Scatter plot of average spontaneous rate (A), noise-evoked response (spontaneous rate subtracted, B), and target-evoked response (noise-evoked response subtracted, C) for each A1 neuron between attend RF and attend away conditions. Black circles indicate neurons with a significant difference between attention conditions for any of the 3 statistics (P < 0.05, jackknife t-test with Bonferroni correction). Target data are shown for the subset of neurons with adequate presentations of probe and catch tones (n = 36/54). (D–F) Histograms show BMI (Eq. 1), reflecting fractional change in spontaneous rate, noise-evoked response, and target-evoked response between attention conditions for each neuron. Neurons with a significant increase are indicated in red, and those with a significant decrease in blue (P < 0.05, jackknife t-test). Median BMI was significant only for noise-evoked responses; spontaneous rate: −0.14 (P = 0.38, n = 16/54, sign test), noise-evoked response: −0.12 (**P = 0.005, n = 26/54), target-evoked response: 0 (P > 0.5, n = 12/36). (G–I) Histograms comparing changes between active and passive conditions for the same neurons, plotted as in D–F. For the active condition, data were combined from the 2 attention conditions. In all comparisons, responses to an identical set of stimuli were used to compute the difference between behavior conditions. Median BMI increased for spontaneous rate and noise-evoked response: spontaneous rate: 0.17 (**P = 0.002, n = 27/54), noise-evoked response: 0.11 (**P = 0.005, n = 38/54), target-evoked response: 0.14 (P = 0.09, n = 13/36).

