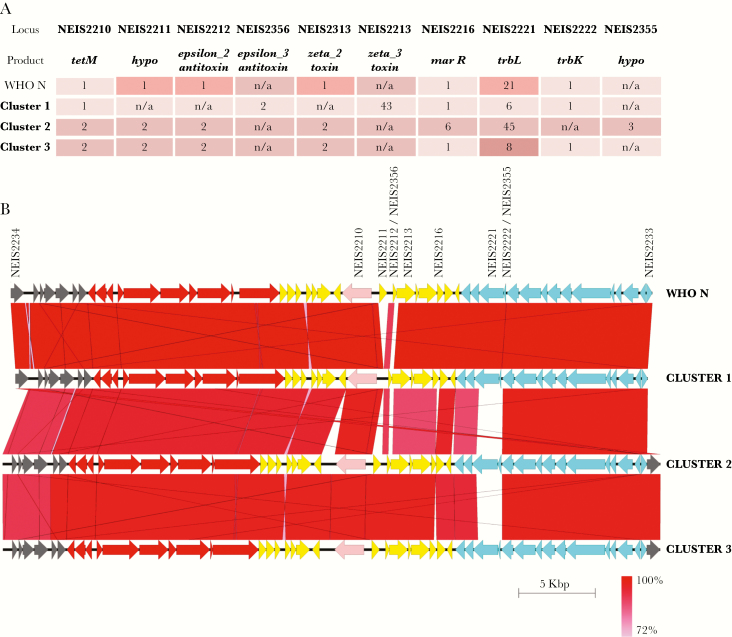
Figure 3.
pTetM plasmids in coastal Kenya. A, Each cluster of isolates has a distinct allelic profile of loci involved in antimicrobial resistance (tetM), plasmid stability (ε/ζ toxin-antitoxin and marR), and mating pair formation (trbK and trbL). Only the most represented alleles in each cluster are listed. B, Alignment of mating pair formation (blue arrows), genetic load (yellow arrows), and conjugative transfer (red arrows) regions in pTetM from clusters 1, 2, and 3 and World Health Organization reference strain N (WHO N). The tetM allele is depicted in pink. Isolates used for alignment are 64500 (cluster 1), 43305 (cluster 2), and 64203 (cluster 3). Sequence similarity between genes is depicted as shades of red, as indicated at the bottom right corner of the figure. pTetM from WHO N, which carries a Dutch tetM allele, is used as a comparison in both panels. hypo, hypothetical protein; n/a, locus not present.

