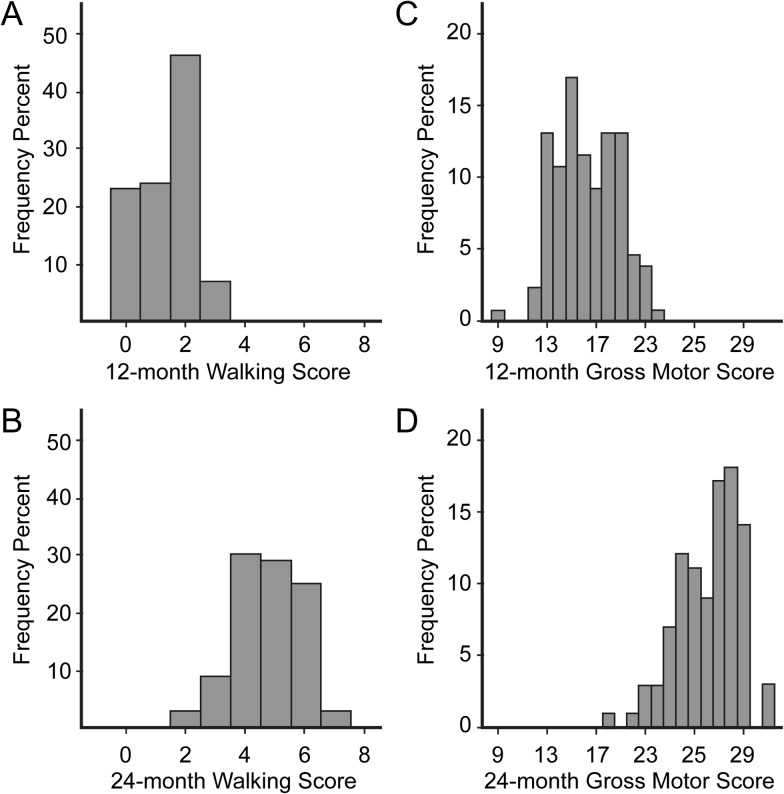
Figure 2.
Walking and gross motor scores are dimensionally distributed at 12 and 24 months. Distributions of raw scores are shown for subjects with brain and behavioral data at 12 (n = 130) and 24 months (n = 99). (a) 12-month walking scores display a range of low values, consistent with emergence of walking at this age. (b) Greater walking scores at 24 months confirm developmental progress. (c) 12-month gross motor scores represent behaviors in addition to walking and show a broader continuous distribution. (d) 24-month gross motor scores are greater than 12-month scores.

