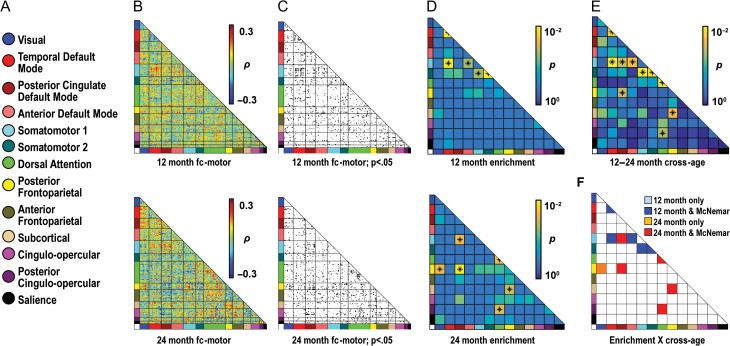
Figure 5.
Enrichment analyses show specific brain–behavior relationships for gross motor scores at 12 and 24 months. (a) A color-coded key of 13 putative infant/toddler networks is shown. (b) Matrices describe relationships between functional connectivity (fc) and gross motor score. Data at 12 and 24 months are shown in the top and bottom rows, respectively (b–d). The 230 ROIs comprising the networks are sorted by assigned network along the X and Y axes. Hot colors indicate strong positive relationships of fc to gross motor score; whereas cool colors indicate strong negative fc-gross motor relationships. (c) The fc-gross motor matrices for 12 and 24 months are thresholded to show ROI pairs with fc-gross motor correlations significant at an uncorrected threshold of P ≤ 0.05. (d) Matrices are colored by P-values for enrichment. Enriched blocks are labeled with an asterisk. (e) This matrix is colored by P-values for the McNemar test, which evaluated differences in the level of enrichment at 12 versus 24 months. Asterisks indicate significant differences. (f) Blocks are colored based on whether they are enriched at a given time point and whether their level of enrichment also differs between time points. Here, significant network blocks (dark blue and red squares) are enriched at either 12 or 24 months and significantly different between 12 and 24 months.

