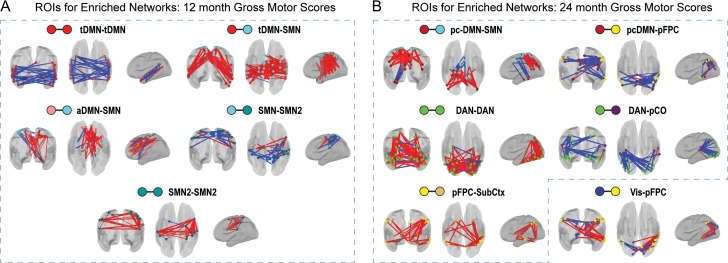
Figure 6.
The sign of fc-gross motor relationships is generally consistent in enriched network blocks. Locations and signs of brain–behavior relationships are illustrated for ROI pairs contributing to enrichment. Spheres represent ROIs. Red and blue sticks represent positive or negative brain–behavior relationships, respectively, between functional connectivity (fc) for an ROI pair and gross motor scores. At 12 months (a) and 24 months (b), all network blocks show primarily positive or negative relationships between fc and gross motor scores. Hatched boxes enclose significant versus discovery results.

