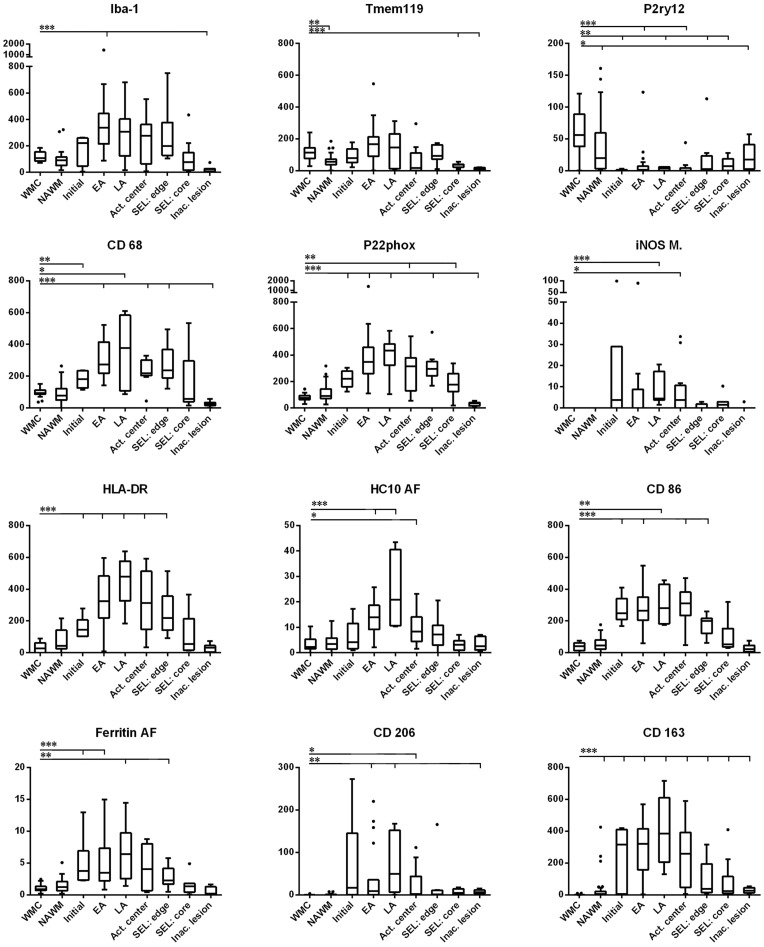
Figure 2.
Quantitative evaluation of microglia/macrophages expressing different phenotypic markers in multiple sclerosis lesions. Following immunohistochemistry for the respective microglia/macrophage markers, the numbers of positive cells were quantified as described in the ‘Materials and methods’ section. Overall, Iba1-positive macrophages and microglia cells are similar in numbers in the normal white matter of controls and in the normal-appearing white matter of patients with multiple sclerosis. In active lesions, these cells increase already in initial lesion stages (when present in pattern III lesions) and reach their peak in early/late active lesion areas. Numerous macrophages are still present in the inactive lesion centre of these plaques. Slowly expanding lesions are surrounded by a rim of microglia cells with some intermingled macrophages and have only very few microglia or macrophages in the inactive lesion centre. A similar quantitative profile is seen for the pro-inflammatory markers CD68 (phagocytosis), p22phox (oxidative burst) and the molecules involved in antigen presentation and co-stimulation (HLA-D, HC10 and CD86). P2RY12, the marker associated with the homeostatic state of microglia in rodents is completely lost in active lesion stages, but reappears on microglia in the centre of inactive lesions. Putative M2 markers (CD163 and CD206) have their peak of expression in late active/ inactive lesions, although their expression patterns were highly variable from case to case. TMEM119 is expressed in about half of microglia and macrophages in active lesions and further decreases in the inactive lesion centres. The values for Iba1, TMEM119, P2RY12, CD68, p22phox, iNOS, HLADR, CD86, CD206 and CD163 are cells per mm2 and thus the numbers in the y-axis are directly comparable. Due to the expression of the respective antigens in other cells in addition to microglia, the values for HC10 (MHC Class I) and ferritin were obtained by quantitative densitometry and are, thus, not directly comparable with the numerical counts for the other markers. WMC = white matter of controls; NAWM = normal-appearing white matter of multiple sclerosis patients; Initial = initial lesions [‘pre-phagocytic’ lesions (Barnett and Prineas, 2004)]; EA = early active lesions; LA = late active lesions; Act. center = macrophage-rich centre of active lesions; SEL: edge = active edge of smouldering lesions; SEL: core = lesion centre of smouldering lesions; Inac. lesions = inactive lesions.

