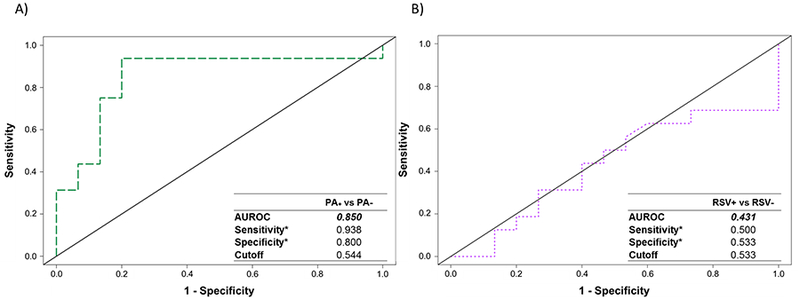
Figure 2.

Receiver operating characteristic (ROC) curves for the discrimination between: A) P. aeruginosa-infected (PA+/RSV− and PA+/RSV+) versus non-P. aeruginosa-infected (PA−/RSV− and PA−/RSV+) cells, and B) RSV-infected (PA−/RSV+ and PA+/RSV+) versus non-RSV-infected (PA−/RSV− and PA+/RSV−), generated using Random Forest. *Optimal sensitivity and specificity of each statistical model are calculated at the given class prediction cutoff (ranging from 0 to 1).
