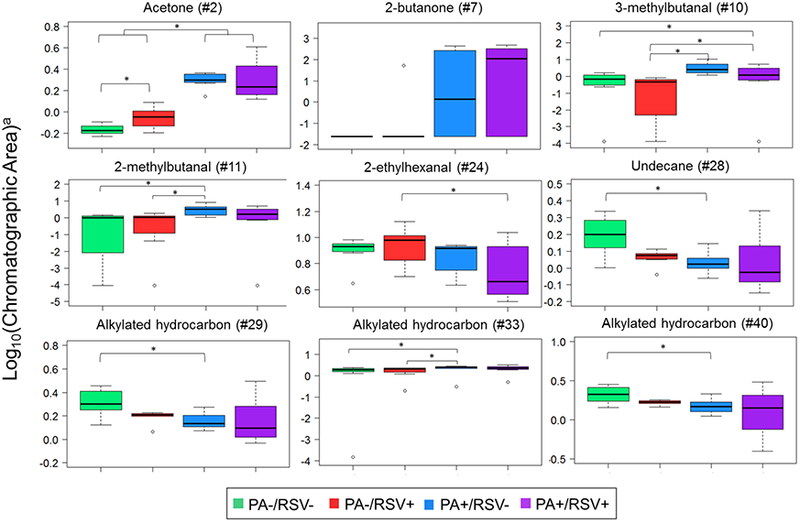
Figure 4.

Boxplot of the most discriminatory features (MDA > 0.01) for discrimination between P. aeruginosa-infected versus non-P. aeruginosa-infected cells. *: p < 0.05. a: Data were mean centered and scaled before plotting. Identification as per Table 1.
