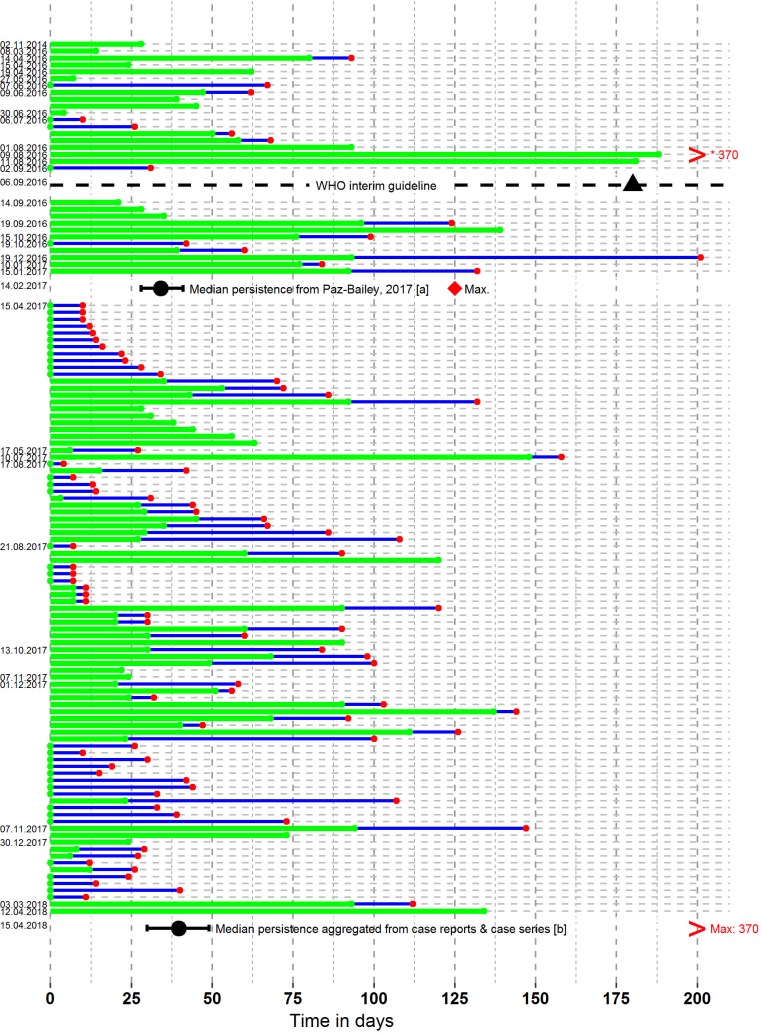
Fig 3. ZIKV detection in semen by RT-PCR.
The x-axis indicates time in days from symptom onset. The labels on the y-axis represent the date of publication of the studies, in chronological order, with the last date indicating the date of this analysis. Green lines represent the duration of RT-PCR positivity in individuals from case reports and case series (n = 119), extending to the last positive RT-PCR measurement. Green dots at day 0 represent an assumption of RT-PCR positivity for patients with no sample taken at symptom onset. Blue lines represent the interval between the last positive measurement and the first subsequent negative measure (red dot). The black dotted line represents the publication of the WHO interim guidelines [2] and the suggested duration of protected sexual intercourse advised in the guidelines (6 months, black triangle). The black dots and whisker bars represent median aggregated values and 95% confidence intervals for [a] a prospective cohort (n = 55 men) [20] and [b] the aggregation of all available case reports and case series. Maximum values in these datasets are shown with a red diamond or a red greater than symbol (for values outside the range of the graph). Lines for which the date is not provided are from the same date as the line above. RT-PCR, reverse transcription PCR; ZIKV, Zika virus.

