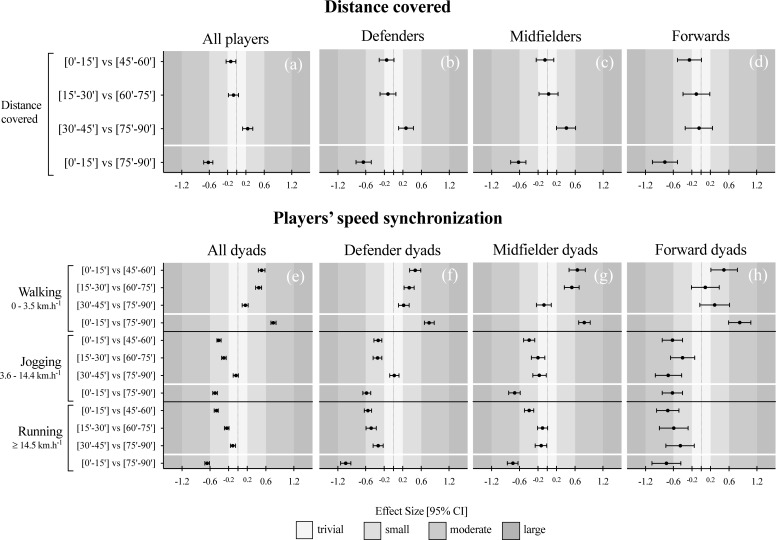
Fig 3.
Standardized (Cohen) differences in players’ distance covered and speed synchronization at different intensity zones and according to different match periods and playing positions (left panel: a, e–all dyads; left central panel: b, f–defender dyads; right central panel: c, g–midfielder dyads; right panel: d, h–forward dyads). Error bars indicate uncertainty in the true mean changes with 95% confidence intervals.

