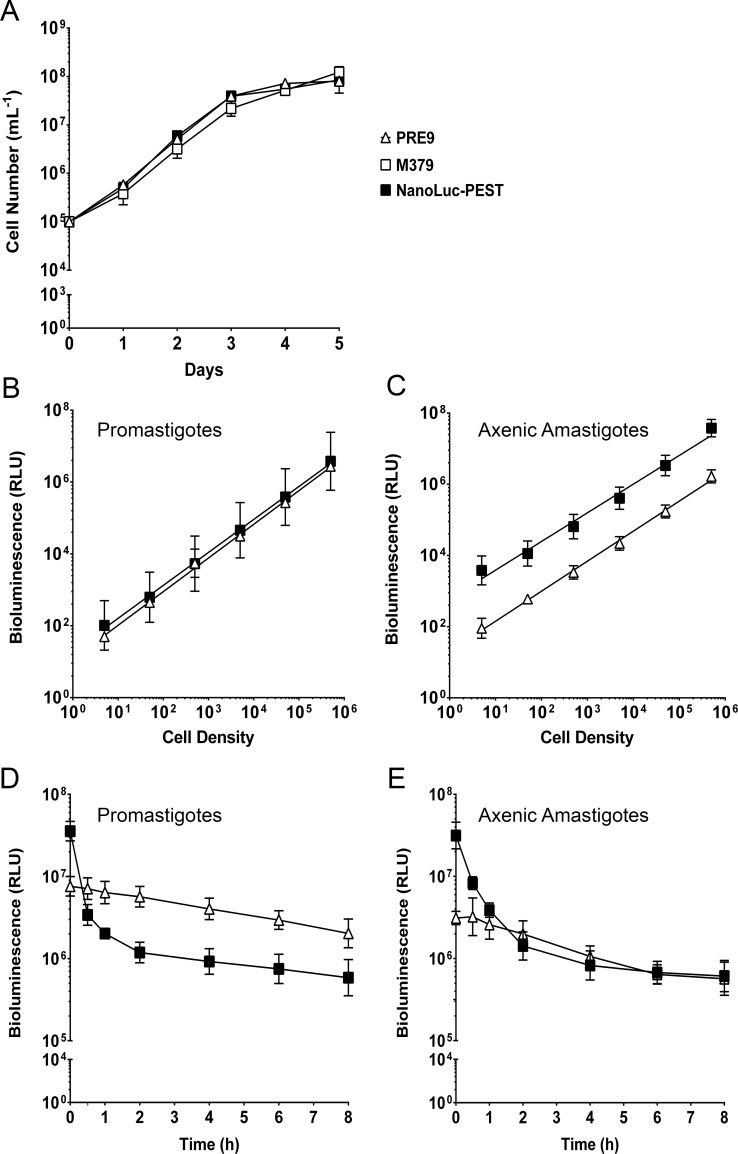
Fig 1. Characterisation of luciferase-expressing L. mexicana transgenic lines.
(A) Promastigote growth curve of parental L. mexicana M379 (open square) and transgenic cell lines expressing PRE9 (open triangle) and NanoLuc-PEST (filled square) monitored over a five day time course. Mean values are shown (n = 3) ± SD. The Y-axis was transformed by log10. (B), (C) Cell density dilution series on the promastigote and axenic amastigote forms, respectively. Both X- and Y-axes were transformed by log10 prior to regression analysis. Mean values are shown (n = 3) ± SD. (D), (E) Cycloheximide assay on the promastigote and axenic amastigote forms, respectively, was monitored over an eight hour time course. The X-axis was transformed by log10 prior to regression analysis. Mean values are shown (n = 3) ± SD.

