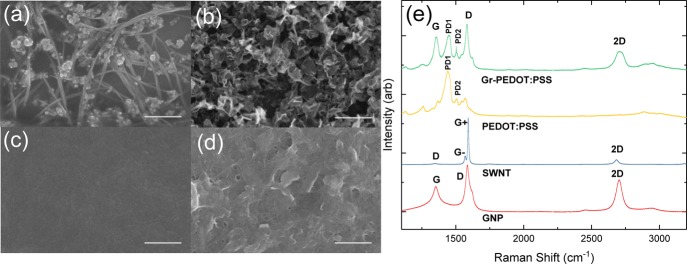
Figure 3.
SEM images of (a) SWNTs (ink 4), (b) GNP (ink 5), (c) PEDOT:PSS (ink 6), and (d) Gr-PEDOT:PSS (ink 7), where the scale bar in each case corresponds to 500 nm. (e) Raman spectra acquired at 514.5 nm on the spray-coated films of SWNTs (blue), PEDOT:PSS (yellow), GNPs (red), and Gr-PEDOT:PSS (green).

