. 2018 Jul 24;7:e34896. doi: 10.7554/eLife.34896

Figure 3. Transmembrane arginine residues control allosteric activation and permeation by Cl-.

(A) Sequence alignment of transmembrane domains TM 7, 1 and 4 from the related VGLUT isoforms and species with highly conserved arginine highlighted (red). (B) Representative whole endosome recordings (with 140 mM NMDG Cl at pH 5.0 in the pipette) of VGLUT1 R314A (C) and R80A (D) (n = 4 each). (E) Representative recordings with 0 mM Cl- in the pipette of endosomes expressing VGLUT1 WT (F) and R176A (G) (n = 5–9). Insets show maximum outward currents in the different external solutions (C, ICl, p=0.547, Iglut, p=0.080 both by paired t-test, D, ICl, p=0.062, Iglut, p=0.782 both by paired t-test, F, ICl, p=0.625 by Wilcoxon, Iglut, p=0.397 by paired t-test, G, ICl, p=0.002, Iglut, p=0.017 both by paired t-test). +p<0.05 and ++p<0.01 by paired t-test. Insets (C,D,F,G) indicate maximal outward currents for each endosome.

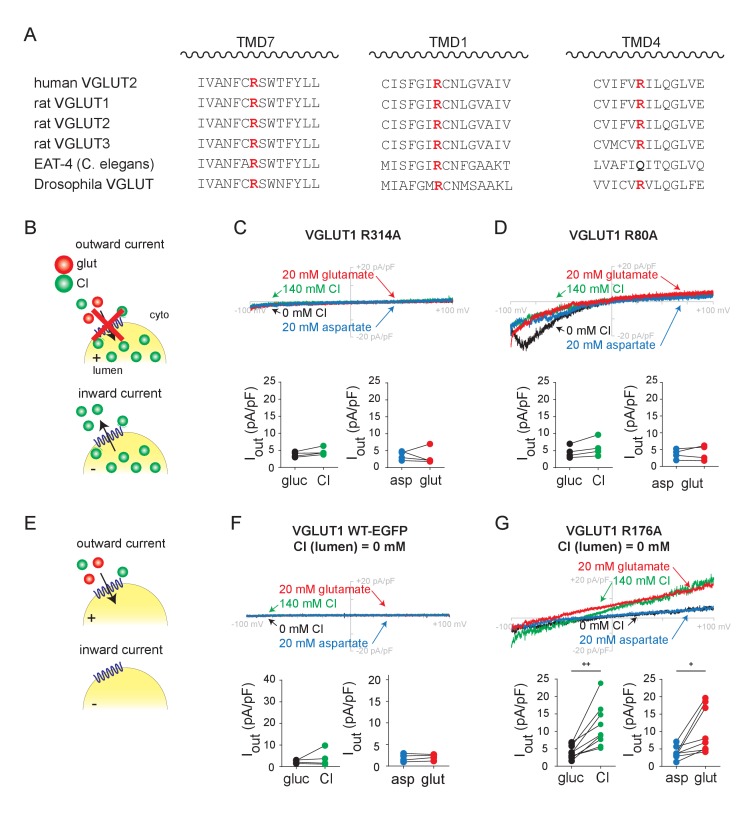
Figure 3.

Figure 3—figure supplement 1. Chloride and glutamate currents in endosomes expressing mutant VGLUTs.

Figure 3—figure supplement 1.

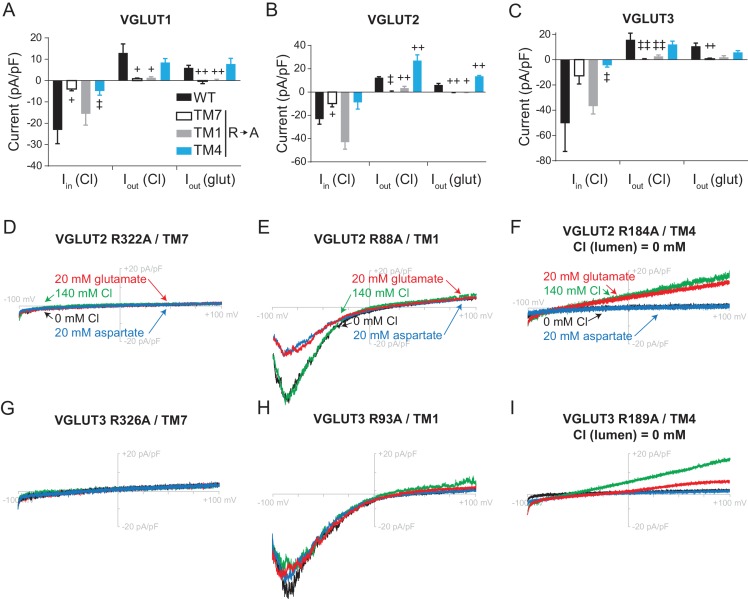
Compiled data (A–C) and sample traces (D–I) for alanine substitutions at conserved arginine residues in TM7, 1 and 4 of VGLUT1 (A), VGLUT2 (B,D–F) and VGLUT3 (C,G–I). All endosomes were recorded with 140 mM NMDG Cl at pH 5.0 in the pipette (n = 3–5) except for those expressing the arginine mutant in TM4, which were recorded with 140 mM NMDG gluconate (0 mM Cl-) in the pipette (n = 4–7). The baselines for outward Cl- and glutamate currents were defined as in Figure 1—figure supplement 1 and Figure 2—figure supplement 2. Bar graphs indicate mean ± SEM. +p<0.05, ++p<0.01 by unpaired t-test and ‡p<0.05, ‡‡p<0.01 by Mann-Whitney test.
Figure 3—figure supplement 2. Chloride and glutamate currents in endosomes expressing TM4 arginine mutants.

Figure 3—figure supplement 2.

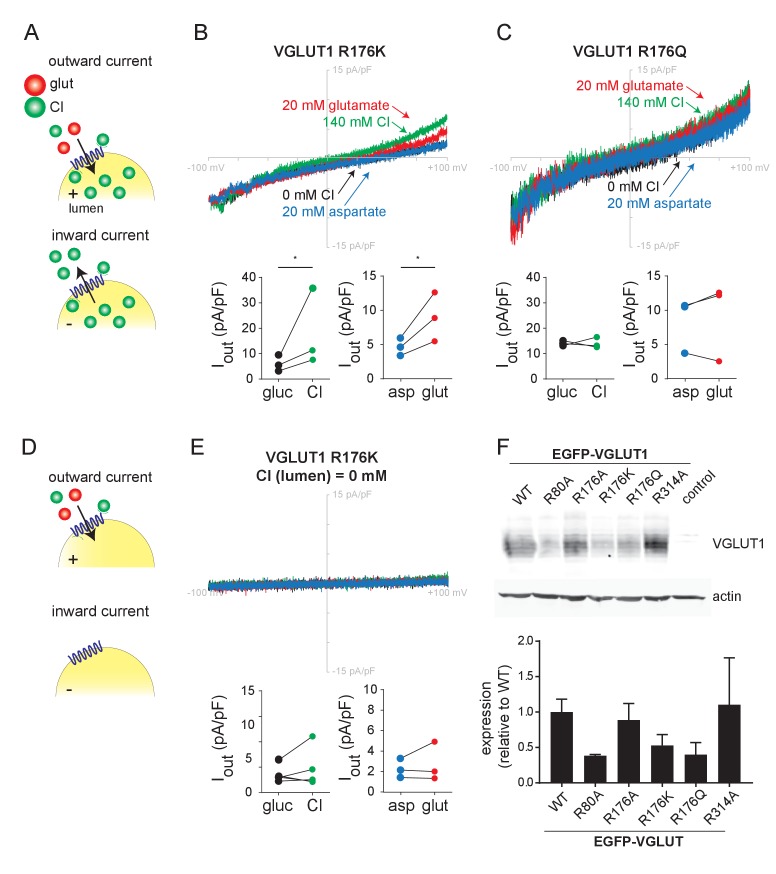
Representative recordings with 140 mM Cl- in the pipette from endosomes expressing VGLUT1 R176K (B) and R176Q (n = 3) (C). Representative recordings with 0 mM Cl- in the pipette of endosomes expressing VGLUT1 R176K (E) (n = 3). Insets show maximum outward currents in the different external solutions (B, ICl, p=0.048, Iglut, p=0.016 both by paired t-test, C, ICl, p=0.963, Iglut, p=0.894 both by paired t-test, E, ICl, p=0.734, Iglut, p=0.629 both by paired t-test. *p<0.05. (F) Western blot of lysates from HEK293T cells expressing VGLUT1-EGFP (WT, R80A, R176A, R176K, R176Q and R314A) and untransfected cells as negative control. The expression of wild type and mutant VGLUT1-EGFP was analyzed by quantitative fluorescent immunoblotting, with VGLUT1 band intensity normalized to actin. Bar graph indicates mean ± SEM. n = 3.
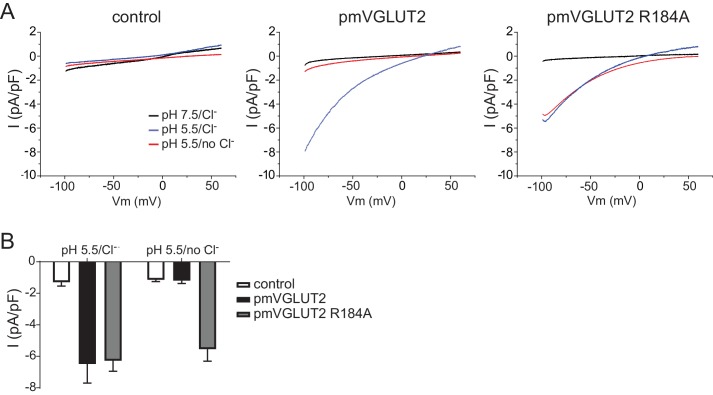
Figure 3—figure supplement 3. R184A eliminates the requirement for external Cl- to activate the inward Cl- conductance of VGLUT2 misexpressed at the plasma membrane.

Figure 3—figure supplement 3.

Whole cell recording of VGLUT2 misexpressed at the plasma membrane (pmVGLUT2) of HEK293T cells. (A) Representative ramp currents from HEK293T cells expressing wild type pmVGLUT2 (left), R184A pmVGLUT2 (middle) or empty vector as negative control (right) in external choline chloride, pH 7.5 (black), choline chloride, pH 5.5 (blue) and choline gluconate, pH 5.5 (red). (B) Maximal inward currents normalized to cell capacitance from voltage ramps of wild type pmVGLUT2 (black), R184A pmVGLUT2 (grey) and vector-only transfected HEK cells (white) in external choline gluconate, pH 5.5 and choline gluconate, pH 5.5. n = 6–9 cells.