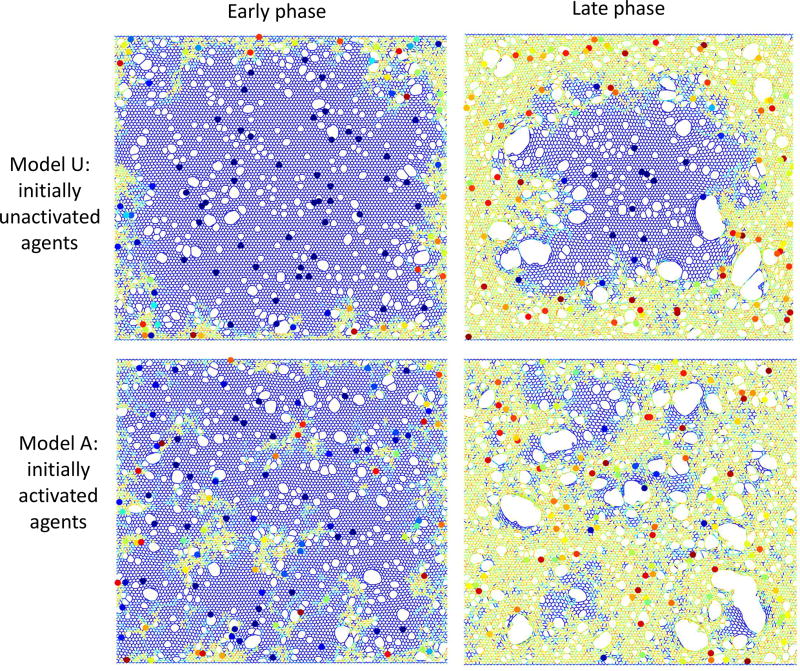
Figure 4.
Example images of the model in the early (left column) and late (right column) phases. The top row shows simulations that began with initially unactivated agents (Model U: Ω0 = 0), while the model in the bottom row had significant initial agent activity (Model A: Ω0 = 2.5 ± 1). Network spring colors are related to local stiffness (blue: low, yellow/orange: high). Agents are shown as circles with colors indicating agent activity (dark blue: low, red: high).

