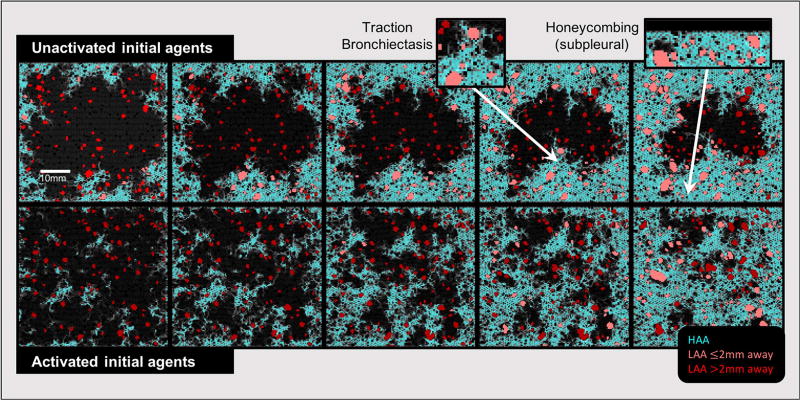
Figure 5.
Equivalent CT images generated from the network model at various stages of fibrosis development beginning with agents that were initially unactivated (top) and activated (bottom). High attenuation areas (HAAs) are shown in cyan. Low attenuation areas (LAAs) are shown in red. LAAs that are near HAAs are light red, while those further away are dark red. Black pixels represent normal parenchyma and airspaces. The two insets show examples of model-based peripheral honeycombing and traction bronchiectasis.

