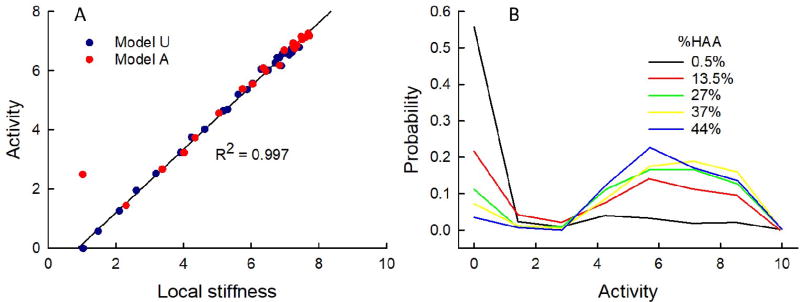
Figure 9.
Distribution of agent activity. A) The mean activity of the agent population versus mean local stiffness computed from the last step of the fibrosis simulations. The black line is a regression line fit to the dark blue data points derived from simulations beginning with unactivated agents (Model U: Ω0 = 0). The simulations beginning with activated agents (Model A: Ω0 = 2.5 ± 1.5) are shown in red. B) Distribution of agent activities for the model with zero initial activity (Model U: Ω0 = 0) at various stages of fibrosis progression given in terms of %HAA.

