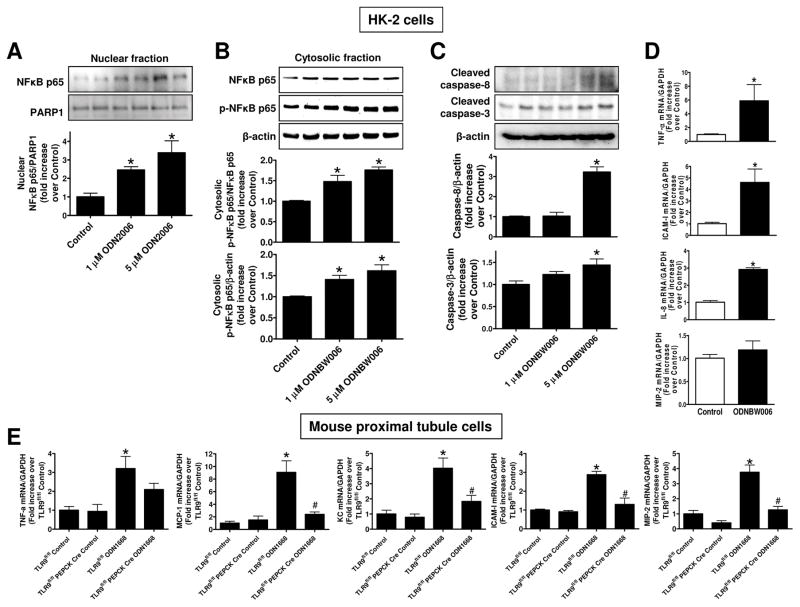
Figure 9. TLR9 agonists induce NFκB activation, caspase cleavage and pro-inflammatory mRNA induction in renal proximal tubule cells.
A–D. HK-2 human renal proximal tubule cells were treated with 1–5 μM TLR9 agonist (ODN2006 or ODNBW006) or with respective control oligonucleotide (ODN2137 or ODN BW007) for 3 days. A. A representative immunoblotting experiment for nuclear p65 NFκB subunit (top) and band intensity quantifications normalized to PARP-1 (N=4, bottom). B. A representative immunoblotting experiment for cytosolic p65 subunit (top) and band intensity quantifications normalized to p65 subunit or β-actin (N=4, bottom) are shown. C. A representative immunoblotting experiment for cleaved caspase 3 and caspase 8 (top) and band intensity quantifications normalized to β-actin (N=4, bottom) are shown. D. With quantitative RTPCR, we measured the expression of pro-inflammatory IL-8, TNF-α, ICAM-1 and MIP-2 mRNA expression in HK-2 cells. Fold increases in pro-inflammatory mRNAs normalized to GAPDH from quantitative RTPCR reactions for each indicated mRNA (N=4) are shown. E. Finally, primary cultures of mouse renal proximal tubules from wild type TLR9fl/fl mice and renal proximal tubule TLR9 null mice were treated with a mouse TLR9 selective oligonucleotide ODN1688 for 3 days. With quantitative RTPCR, we measured the expression of pro-inflammatory IL-8, TNF-α, ICAM-1, MCP-1 and MIP-2 mRNA expression in primary cultures of mouse renal proximal tubules. Fold increases in pro-inflammatory mRNAs normalized to GAPDH from quantitative RTPCR reactions for each indicated mRNA (N=4) are shown. For statistical analysis, the one-way ANOVA plus Tukey’s post hoc multiple comparison test were used to detect significant changes. *P<0.05 vs control oligonucleotide-treated cells. #P<0.05 vs. TLR9fl/fl renal proximal tubule cells treated with ODN1668. Error bars represent 1 SEM.

