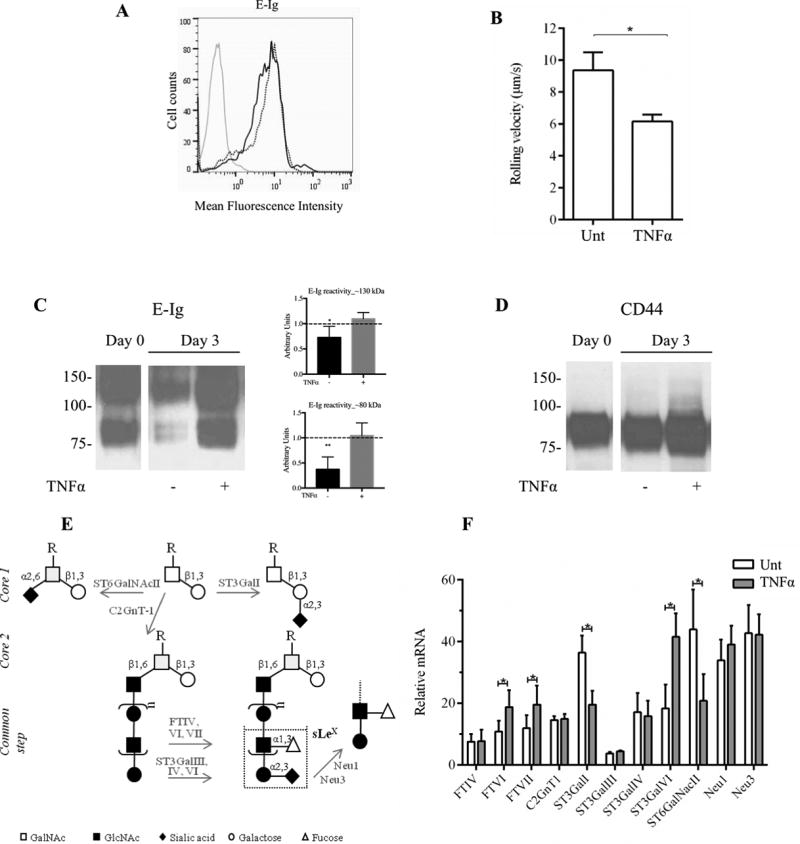
Figure 5. E-selectin ligand expression on cultured human CD14-S mo-DCs is preserved by TNFα treatment.

(A) Flow cytometry analysis of E-Ig reactivity on CD14-S mo-DCs. Representative histograms of E-Ig staining of untreated mo-DCs (dotted black line) and mo-DCs treated with TNFα (solid black line) collected after 3 days of culture. Grey line represents E-Ig staining in absence of Ca2+. (B) Rolling adhesive interactions on TNFα-stimulated HUVECs of cultured CD14-S mo-DCs untreated (Unt) or treated with TNFα (TNFα) for 3 days. Rolling velocities were measured at shear stress of 2.0 dyn/cm2. The velocity was calculated by measuring the displacement of the centroid of the cell over 1 sec.; lower rolling velocity of TNFα mo-DCs indicates higher avidity to E-selectin. (C) Western blot analysis of E-Ig reactivity of whole cell lysates of CD14-S mo-DCs. Cells were left untreated (−) or treated (+) with TNFα (at Day 0) and collected at Day 3 after treatment. Representative western blot analysis (left) and the average quantifications of E-Ig reactivity obtained by densitometric analysis of three independent experiments (right) show that lysates obtained from TNFα-treated mo-DCs display higher E-Ig reactivity at bands at ~130 kDa and ~80 kDa, than those obtained from untreated DCs. Values are shown in arbitrary density units as the density ratio of the ~130 kDa (Top plot) and ~80 kDa (Bottom plot) bands obtained from DCs collected at Day 3 in relation to those obtained from DCs collected at Day 0. Statistically significant differences (P ≤ 0.05) are indicated by asterisks. (D) Western blot analysis of CD44 expression of CD14-S mo-DCs. Cells were collected at Day 0 and Day 3 with (+) or without (−) TNFα treatment. As shown in the figure, TNFα treatment sustains the expression of HCELL in vitro. (E) Schematic of sLeX biosynthesis on N- and O-glycans. Enzymes that were analyzed in this study are indicated in grey next to the arrows: core 2-synthase (C2GnT1), sialyltransferases (ST3GalI, ST3GalIII, ST3GalIV and ST3GalVI, ST6GalNAcII), fucosyltransferases (FTIV, VI and VII), and sialidases (Neu1, Neu3). (F) Real-time PCR analysis showing relative expression of selected genes. The relative mRNA level was computed as the permillage fraction (‰, i.e., the proportion of target mRNA per thousand of the reference GAPDH mRNA expression) of mo-DCs treated for 3 days with TNFα (grey bars) or left untreated (white bars). Values are means ± SD (n= 3). Statistical significant differences (P ≤ 0.05) are indicated by asterisks.
