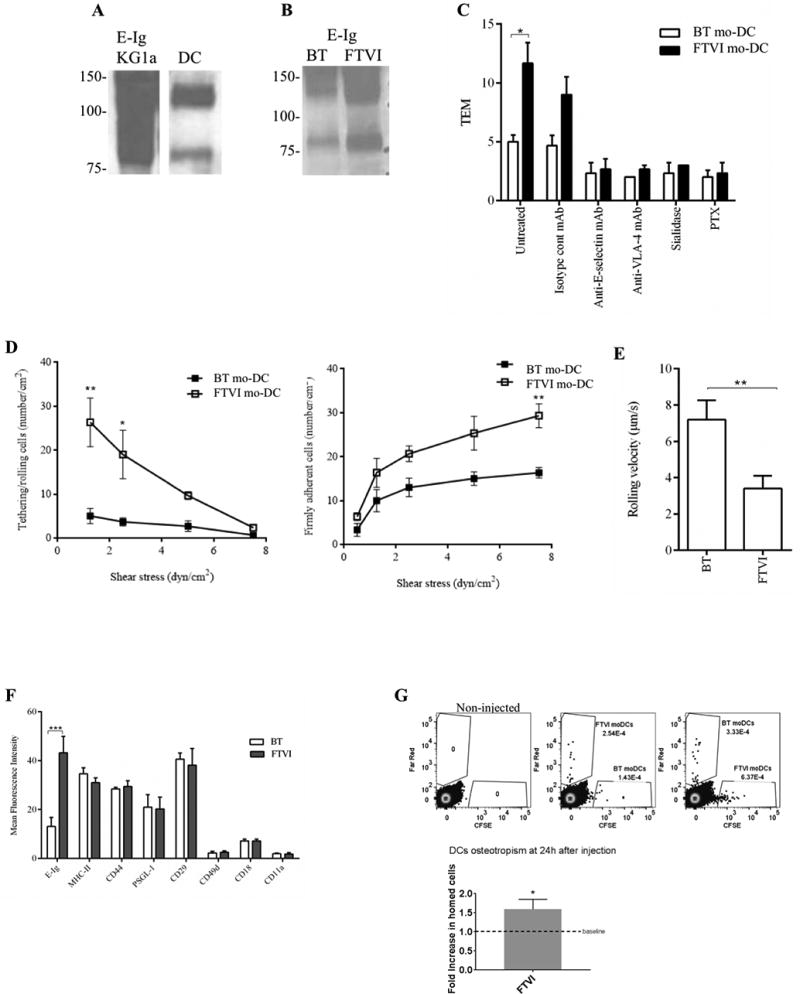
Figure 6. Enforced fucosylation of human CD14-S mo-DCs yields higher E-selectin binding.

(A) Western blot analysis comparing E-selectin binding (E-Ig reactivity) of KG1a and CD14-S mo-DCs. Input lysates on each blot were normalized to equivalent cell numbers. (B) Effects of exofucosylation on E-selectin ligand expression of mo-DCs. CD14-S mo-DCs were buffer treated (BT) or FTVI-treated, and lysates (of equivalent cell numbers) were analyzed by Western blot for reactivity with E-Ig. (C) Transendothelial migration (TEM) assay of buffer treated (BT) and FTVI-treated CD14-S mo-DCs. The relative TEM value is the ratio of mo-DCs transmigrated on TNFα-stimulated HUVECs compared with mo-DCs transmigrated on non-stimulated HUVECs. TEM was assessed using mo-DCs (untreated), HUVECs preincubated with function blocking anti-E-selectin mAb clone 68-5H11, mo-DCs preincubated with function blocking anti-VLA-4 mAb HP2/1 or isotype mAb, and mo-DCs treated with sialidase or PTX. (D) Analysis of mo-DCs tethering/rolling interactions and firm adherence on TNFα-stimulated HUVEC monolayers under flow conditions. Left: Shear stress was increased stepwise every 30 seconds, and the number of tethering/rolling cells per cm2 of HUVEC was counted, during each 30 second segment. Right: At the end of each time segment, the number of cells that became firmly adhering per cm2 area was measured. (E) Average rolling velocity of BT- and FTVI-treated mo-DCs perfused over TNFα-stimulated HUVECs. The velocity was estimated at 2.0 dyn/cm2 flow, as the displacement of the centroid of the cell over 1 sec. Values are means ± SD (n= 3). Statistically significant differences are indicated by asterisks. (F) FTVI treatment does not affect cell surface protein expression. Flow cytometry analysis of E-Ig reactivity, MHC-II, CD44, PSGL-1, CD29, CD49d, CD18 and CD11a staining on buffer treated (BT, white bars) and FTVI-treated CD14-S mo-DCs (dark grey bars). Statistically significant differences are indicated by asterisks. (G) FTVI treatment of CD14-S mo-DCs improves their homing to bone marrow. FTVI-treated or buffer-treated (Unt) mo-DCs were labeled reciprocally with either CFSE or Far Red and mixed at 1:1 ratio. CFSE and Far Red labeled cells were retro-orbitally co-injected into NSG mice, with dye combination swapped between the mice. 24h after injection, bone marrow was harvested and the presence of labeled cells in BM was assessed by flow cytometry. At left, representative flow cytometry plots show mo-DCs migration to BM. At right, FTVI-treated mo-DCs show significantly increased BM homing compared to buffer treated-mo-DCs (baseline). Data are shown as mean ± SEM. P-values calculated by unpaired 2-tailed student's t-test (*, P <0.05). Data are representative of 6 mice (3 mice for each dye combination).
