
Figure 3. Marginal estimates and 95% confidence intervals of change in albuminuria over time by registry arm.
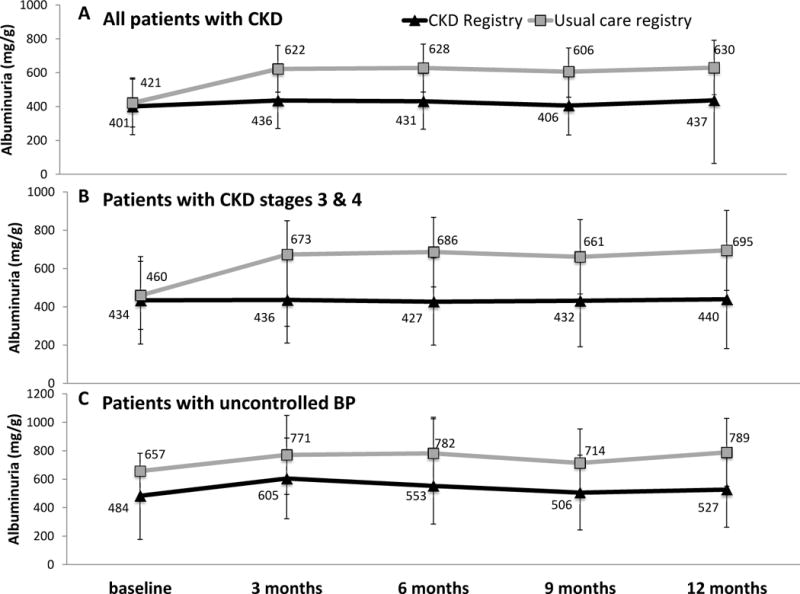
(A) all CKD patients (n=487; 1736 observations; average 3.6 observations per patient), (B) patients with CKD stage 3 & 4 (n=347; 1272 observations; average 3.7 observations per patient), (C) patients with uncontrolled BP at baseline (n=175; 622 observations; average 3.6 observations per patient). Estimates are adjusted for age, gender, race/ethnicity, clinic, and participation in a health coaching study, as well as primary care team, primary care provider and patient clustering.