
Figure 1.
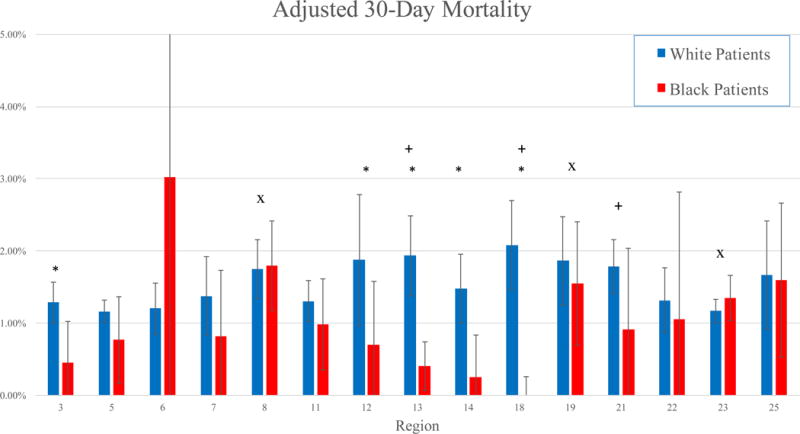
Adjusted 30-day mortality by region in Black and White patients.
*: P < .05 for Black patients compared to White patients
+: P < .05 for White patients in that region compared to White patients in other regions
x: P < .05 for Black patients in that region compared to Black patients in other regions