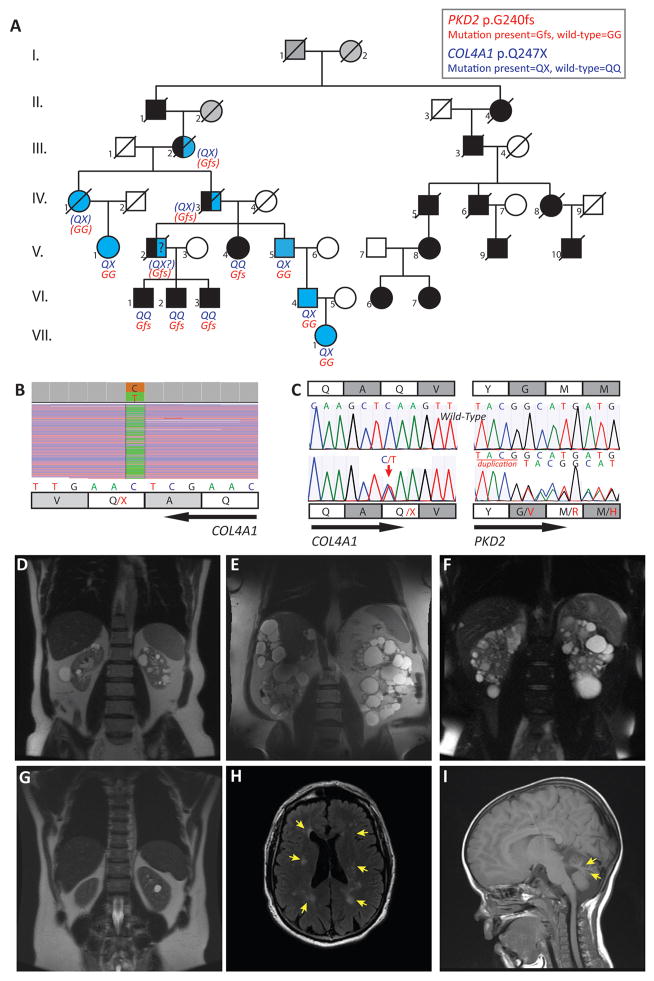
Figure 1. Molecular and imaging data for Pedigree M625 with ADPKD-PKD2 and COL4A1-associated diseases.
A. Disease segregation in pedigree M625. Black symbols denote ADPKD-PKD2 affected individuals, blue symbols denote patients with COL4A1-associated diseases, and gray shading is used when the status of the individuals is unknown. Blue and black symbols are used in individuals with suspected digenic COL4A1-PKD2 disease. Slash over symbols denotes death. Genetic results were not available in III.2, IV.1, IV.3 but their status could be inferred from their medical records (IV.1 and IV.3) and/or from the dominant inheritance pattern of both diseases (III.2, IV.1, IV.3) (inferred genotype within parentheses). Subject II.1, who died at 63y, had a positive familial history of ADPKD (The ADPKD-affected descendants of II.4 are represented on the pedigree, and live in Europe, but no further information is available). Whether he also carried the COL4A1 variant is uncertain. Subject III.2 died at 46y from uremia; she was likely carrying both variants that she passed on to IV.1 and IV.3; for her husband (III.1), who died at age 72, no relevant past medical history was mentioned. B. IGV (integrative genomics viewer, Broad Institute) view of the next-generation sequencing of IV.6 shows COL4A1 variant c.739C>T (p.Gln247*) (reverse strand). Read depth: 2822, C=49%, T=51%. C. Sanger sequencing confirmation of heterozygous COL4A1 variant c.739C>T (p.Gln247*) in V.5, and PKD2 variant c.715_718dupTACG in VI.3. The wild-type sequences are shown for comparison. D. MRI, T2 weighted, of the COL4A1 subject V.5, 61y, showing bilateral renal cysts without kidney enlargement (HtTKV=200ml/m). E. MRI, T2 weighted, of PKD2 patient VI.1 at 53y, showing enlarged polycystic kidneys (HtTKV=1953 ml/m). F. MRI, T2, of PKD2 patient VI.2, who has moderately enlarged polycystic kidneys at 46y (HtTKV=470ml/m). G. MRI, T2, of COL4A1 individual VI.4 who has non-enlarged kidneys at 35y, with six cysts in the left kidney (the largest shown here measures 1.6 cm) and two millimeter sized cysts in the right kidney. H. Cerebral MRI of COL4A1 subject V.5, Axial FLAIR (fluid-attenuated inversion recovery) sequence demonstrating bilateral areas of signal hyperintensity in the centra semiovale (arrows). I. Cerebral MRI in COL4A1 subject VII.1 (4y), sagittal T1 weighted sequence showing marked volume loss in the superior cerebellar vermis (arrows).

