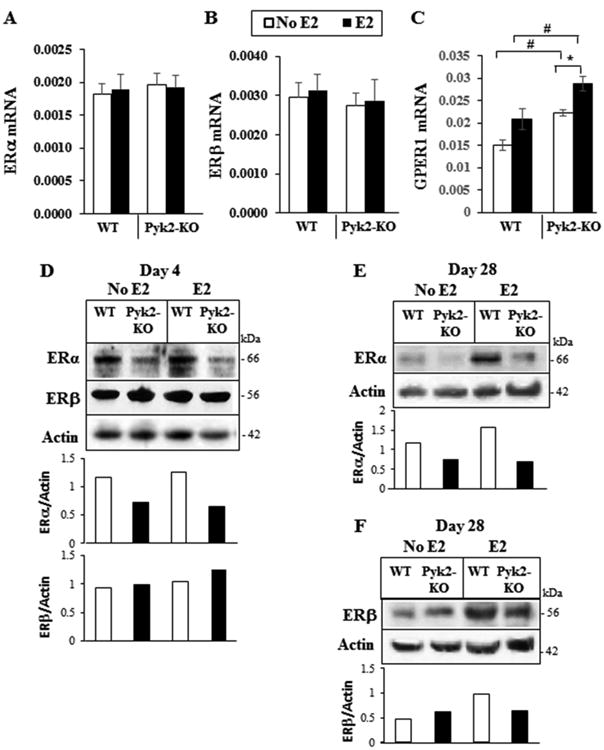
Figure 5. Expression of ERs in WT and Pyk2-KO OBs.

A-C) WT and Pyk2-KO OBs were cultured with or without 100 nM E2 for 4 days. The mRNA expression levels for ERα, ERβ and GPER1 (GPR30) were determined by QPCR. GAPDH was used as the housekeeping gene. The mean Ct values for the GAPDH housekeeping gene are: ERα and ERβ (WT, 14.0 ± 0.04; Pyk2-KO, 14.01 ± 0.04), and GPER1 (WT, 21.13 ± 0.07; Pyk2-KO, 20.89 ± 0.06). The data are mean ± SEM of quadruplicate samples. Statistical significance of p<0.05 is indicated as (*) for E2 treatment effects within a genotype. The (#) indicated significance between genotypes cells for the same treatment. D-F) WT and Pyk2-KO OBs were cultured for 4 days (D) or 28 days (E and F) with or without 100 nM E2. Total cell lysates from WT and Pyk2-KO OBs were resolved by SDS-PAGE and blotted using antibodies specific to ERα or ERβ as indicated (also see supplementary Figure S2). ERα and ERβ protein levels were quantified by densitometry using ImageJ software and normalized to β-actin levels.
