
Figure 11. NemaFlex quantitates maximum muscular strength in C. elegans.
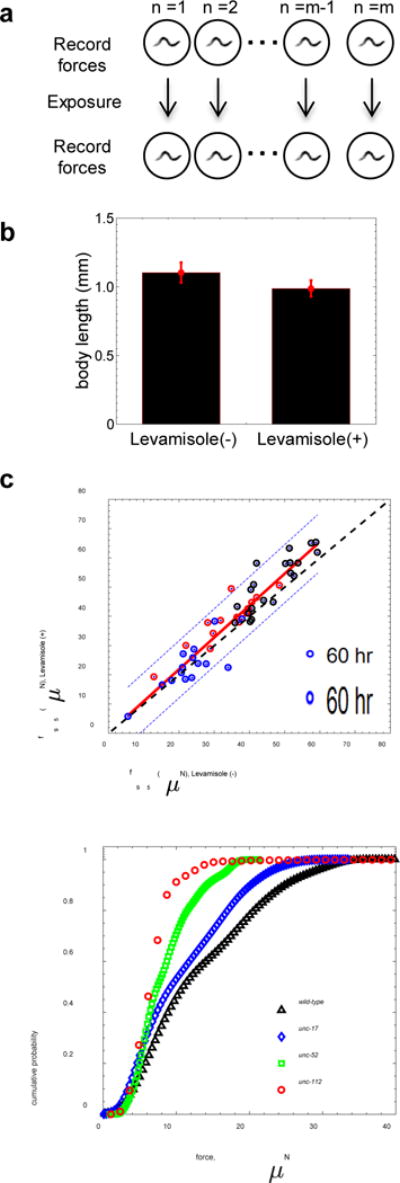
(a) A brief protocol for imaging and inducing muscle contraction on individual wild-type C. elegans with 1 mM levamisole. A 60-second episode is captured for each animal before levamisole treatment, and capturing continues for 60 to 200 seconds after the induction. (b) Levamisole treatment-induced muscle contraction causes the body length to decrease by 10.4 ± 3.2%. (age = 60 – 84 hrs, n=51, p < 0.0005). (c) Maximum strength of individual animals before and after the levamisole treatment for three different age groups – 60 hrs (n = 15), 76 hrs (n = 14) and 84 hrs (n = 20). The red line is a linear best fit of the pooled data: slope =1.09 +/− 0.06, intercept = -0.006, and r2 =0.89. Dashed blue lines show the 95% level confidence interval (n =49). The dashed black line represents f95lev+ = f95lev- (slope of 1 and intercept at origin). A two sample t-test confirms that NemaFlex is measuring the maximum muscular strength of the animal (p =0.24). For this data set, D/s = 0.95 - 1.02. (d) Comparison of population-level force distribution for wild type (n=20, N=3,475 data points) and three C. elegans muscular or neuromuscular mutants unc-52 (n=12, N=14,883 data points), unc-112 (n=5, N=2,992 data points), and unc-17 (n=20, N=6,997 data points). Wilcoxon rank-sum test confirms that NemaFlex is measuring neuromuscular weakness (p > 0.005). For this data set, D/s = 0.85 - 0.92.