
Figure 4. Data analysis workflow for NemaFlex strength measurement.
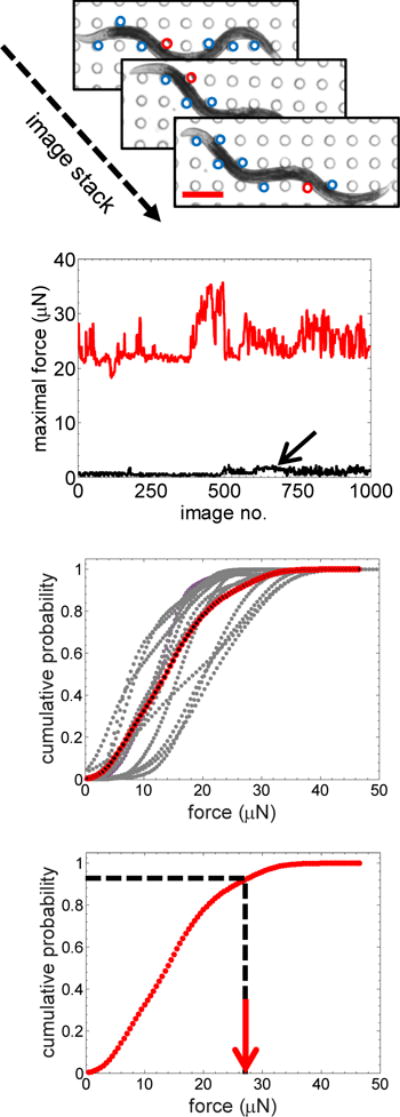
(a) Stack of images showing the worm interacting with different pillars during a locomotory episode. The deflected pillars are circled in blue, and the red circle denotes the pillar that experiences the maximum force. Scale bar, 200 μm. (b) Variation of maximal force over time due to a worm interacting with pillars (in red). The black curve shows force variation from the pillars that are not in contact with the worm – giving an estimate of error in our force measurement. (c) Cumulative probability distribution curves of maximal forces for different worms (age = 60 hrs) showing the variability between individuals (n = 14). The red trace represents the cumulative force distribution curve for the population. (d) From the cumulative force distribution curve, the maximum exertable force, f95, is defined as the maximal force at 95% cumulative probability.