
Figure 5. Resistance to locomotion determines maximal forces.
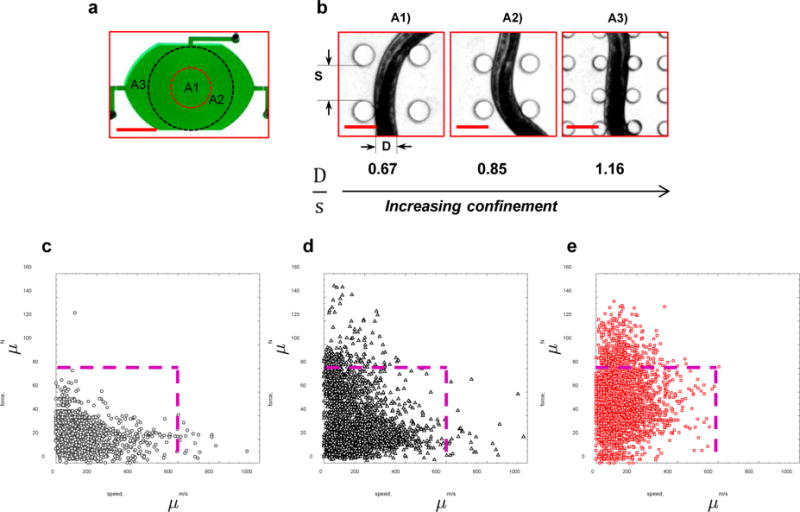
(a) A composite micropillar arena containing sections A1, A2, and A3 with different pillar spacings to investigate the influence of animal confinement on force generation. Scale bar, 5 mm. (b) The same nematode shown in the three different arenas. The level of confinement (D/s) increases as the worm crawls from arena A1 to A3. Scale bar, 100 μm. The force-velocity data for animals in (c) A1, (d) A2, and (e) A3 arenas. The lines indicate force-velocity cut-offs of 80 μN and 600 μm/s. The data correspond to 17 WT individuals of age 84 hours.