Figure 3.

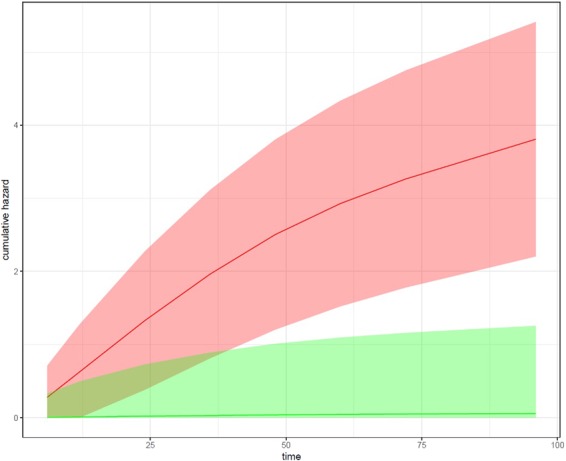
Cumulative hazard as a function of time for the 10% patients with highest AD risk scores (red) and 10% patients with lowest AD risk scores (green). Depicted are the average risk curves plus standard errors as confidence bands.

Cumulative hazard as a function of time for the 10% patients with highest AD risk scores (red) and 10% patients with lowest AD risk scores (green). Depicted are the average risk curves plus standard errors as confidence bands.