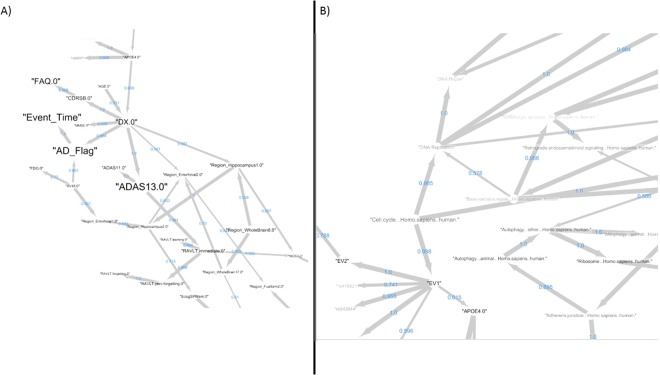
Figure 4.
Edges appearing in more than 50% of 1000 Bayesian Network reconstructions based on random sub-samples of the data. Line thickness is proportional to the relative frequency of observing an edge in the 1000 network reconstrucions, and the corresponding number is shown as edge label. The node size is proportional to the relative influence of the variable in the final GBM model, and the color reflects the selection frequency in the repeated cross-validation procedure (more black = higher stability). Sub-figures (A) and (B) depict two examples zooms into the overall network.

