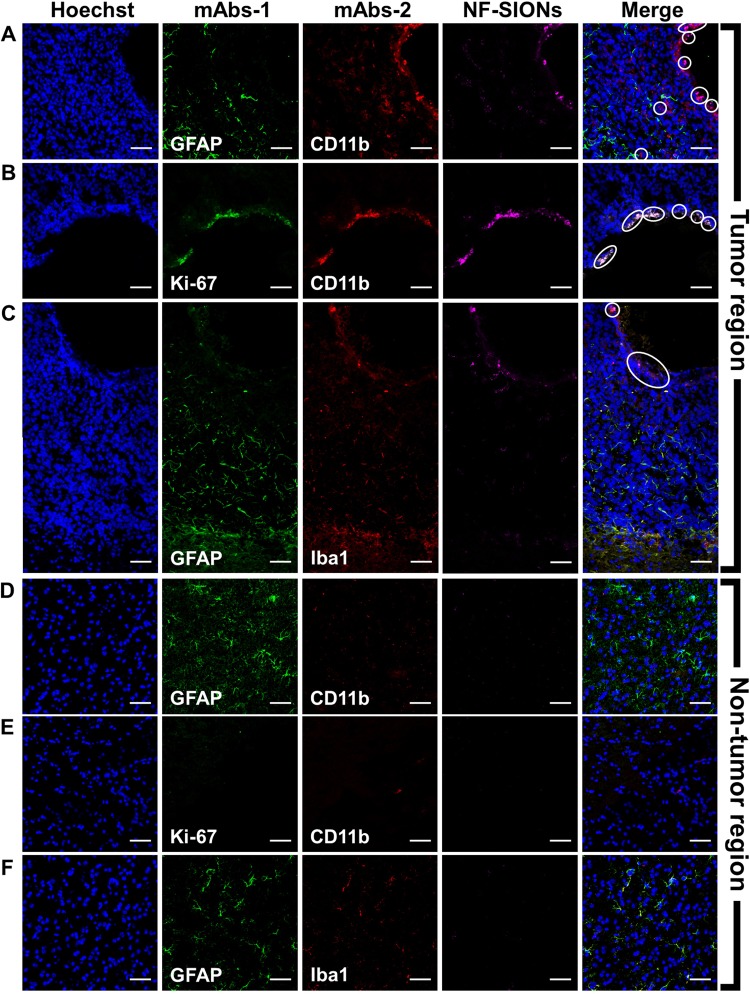
Figure 10.
Characterization of targeting and distribution of NF-SIONs in the brain tumor region (A–C) and non-tumor region (E 9G) by immunofluorescence staining, 8 hr after injection. The shown sections were stained each with two monoclonal antibodies (mAbs; green and red) against GFAP (A,C,D and F, astrocyte), CD11b (A,B,D and E, monocytes/macrophages), and Iba1(C and F, microglia). Compared with the non-tumoral region, macrophages and microglial cells were highly expressed in the tumor region, and nanoparticles-binding cells were well overlapped with tumor-associated macrophages/microglias (CD11b+ or Iba-1+ cells), but not with astrocytes (GFAP+ cells). Blue and magenta signals show the location of cell nucleus and NF-SIONs, each. White circles indicate co-localization of TAMs and NF-SIONs, and the hole seen in the tumor region was due to the injection process of tumor cells. Scale bar: 50 μm (×40).

