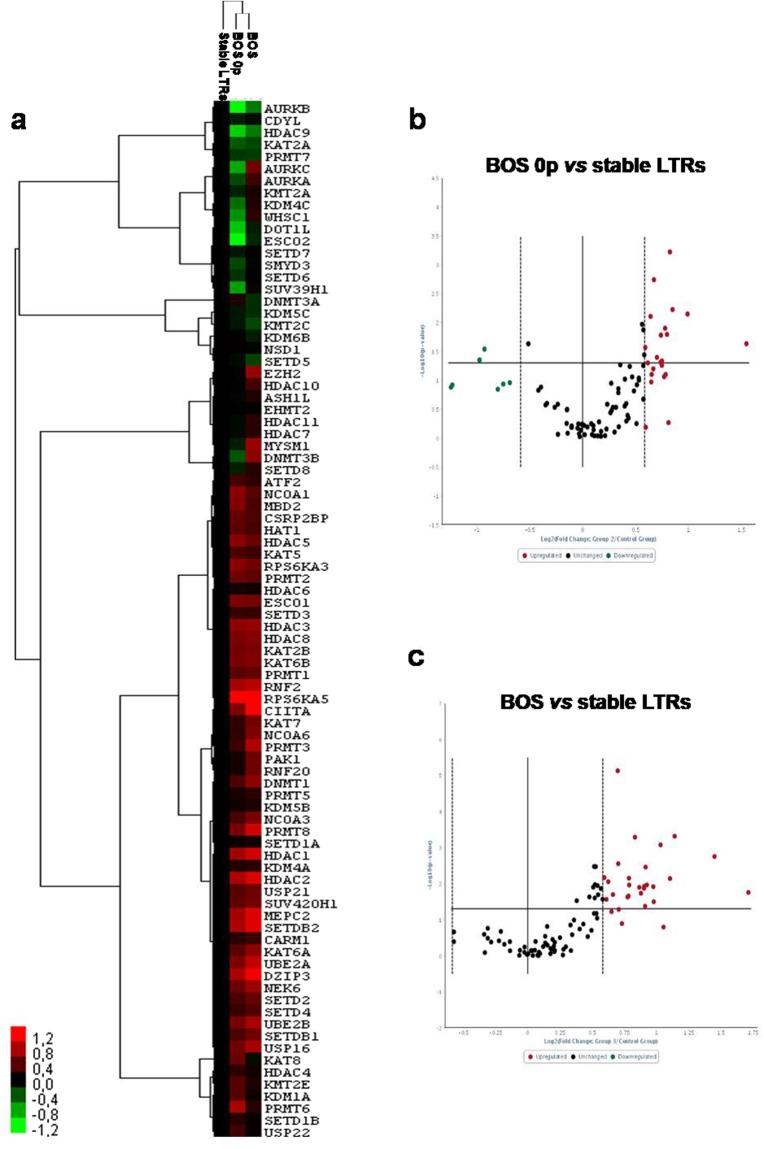
Figure 1.
MSC from BALf of BOS patients differentially express epigenetic enzymes respect to those of stable LTRs. (a) Non-supervised hierarchical clustering based on the gene expression levels in MSC from BALf of stable LTRs, BOS 0p and BOS (n = 5, n = 2, n = 3, respectively). The dendrogram shows the relationships among gene expression patterns: “red” indicates high relative expression, “black” no change, and “green” low relative expression. Volcano plots showing differentially expressed genes between BOS 0p vs stable LTRs (b), and BOS vs stable LTRs (c). The volcano plot displays statistical significance versus fold-change on the y- and x-axes, respectively. A total of 86 genes were analysed. 17 genes have significantly different expression in MSC from BOS 0p samples respect to controls (p ≤ 0.05): 15 with fold change ≥1.5, and 2 with fold change ≤0.5. Twenty-three genes were significantly upregulated (fold change ≥ 1.5), when comparing the mRNA expression levels between MSC from stable LTRs and BOS samples.

