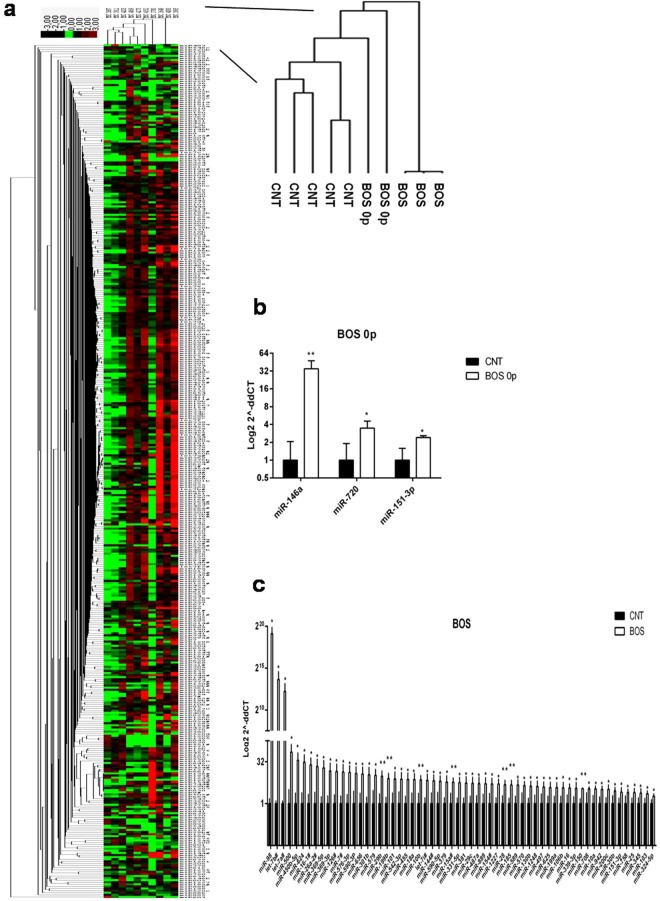
Figure 3.
Differentially expressed miRNAs in MSC from BALf of BOS, BOS 0p and stable LTRs. (a) Non-supervised hierarchical clustering based on the miRNA expression levels in MSC from BALf of stable LTRs, BOS 0p and BOS (n = 5, n = 2, n = 3, respectively). Cluster 3.0 and Treeview softwares were used. The dendrogram shows the relationships among miRNA expression patterns. Red colour indicates upregulated genes, black colour downregulated genes and green colour indicates no change. A total of 754 miRNAs were analysed. 3 miRNAs are up-regulated in MSC from BOS 0p samples respect to controls (fold change ≥ 1.5; p ≤ 0.05); (b) 60 miRNAs were significantly upregulated (fold change ≥ 1.5; p ≤ 0.05), when comparing the miRNA expression levels between MSC from BOS samples respect to stable LTRs (c). Data are expressed as Mean (log2 scale) (±SD). *p ≤ 0.05; **p ≤ 0.001, two-tailed Student’s test.

