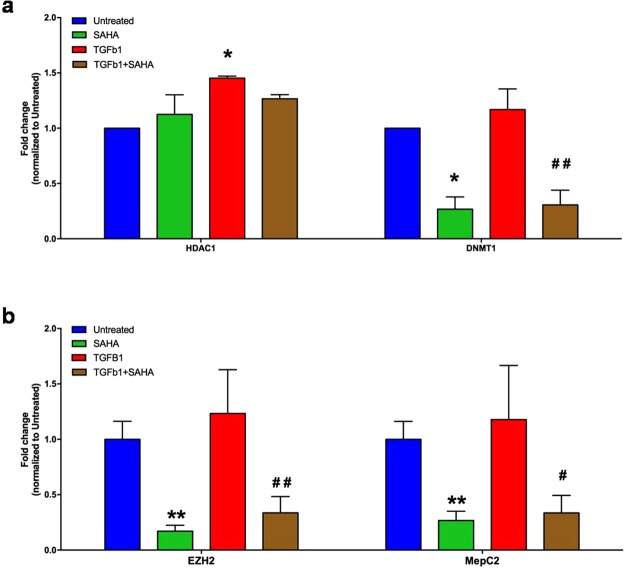
Figure 6.
SAHA influences epigenetic gene expression. Quantitative RT-PCR results of HDAC1 and DNMT1 (a), EZH2 and MepC2 (b) in MRC5 treated with or without SAHA and/or TGF-β1. Data are expressed as Mean (±SD). One star (*) indicates a p ≤ 0.05, while two stars (**) indicate a p ≤ 0.01, compared to control group; # and ## indicate a p ≤ 0.05 or p ≤ 0.01, respectively, compared to TGF-β1-treated group, two-tailed Student’s test.Three independent experiments were carried out with three replicatesfor each experimental condition.

