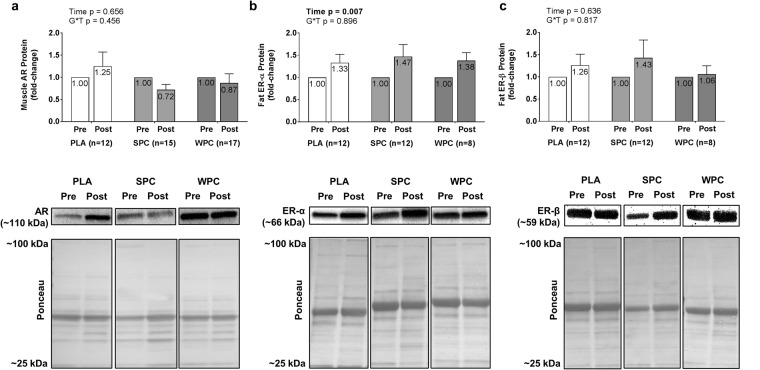
Figure 3.
Fold-change values in muscle androgen receptor protein expression (panel a), adipose tissue estrogen receptor-alpha (ERα, panel b), and ERβ (panel c) are displayed. Post protein expression values were divided by pre protein expression values for calculation within each subject. Error bars for fold-change scores represent standard error of the mean. Representative Western blot images were cropped from different parts of the same gels, and representative whole gels are made available in the supplementary information file.

