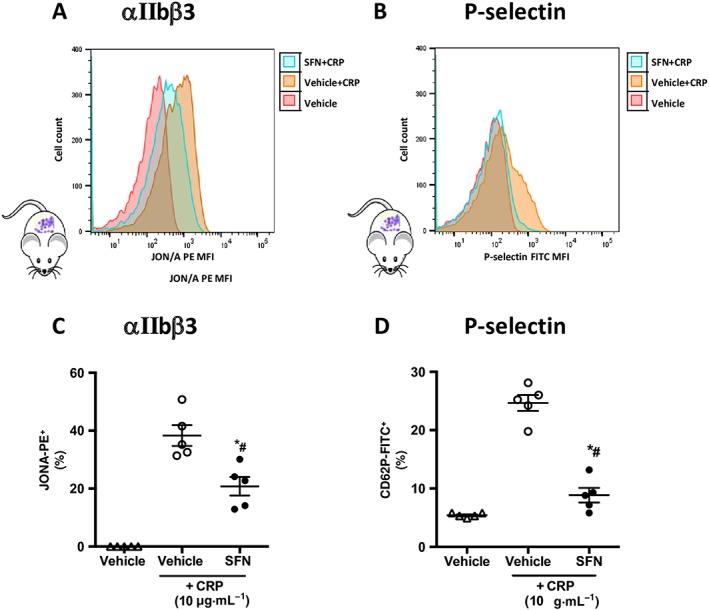
Figure 7.

Platelet expression of cell surface receptors following CRP stimulation. Activated integrin αIIbβ3 and P‐selectin were quantified using flow cytometry in platelets following 15 min stimulation with CRP at 10 μg·mL−1. Vehicle or SFN treatment (60 μM) was given 30 min prior to activation. (A and B) representative histograms of activated αIIb β3 and P‐selectin expression on platelets treated with SFN/vehicle +/− CRP stimulation. Mean fluorescence intensities of platelet (C) activated integrin αIIbβ3 (GPIIbIIIa) and (D) P‐selectin. Data are mean ± SEM of n = 5 mice per group. * P < 0.05 versus control (vehicle) and CRP group. # P < 0.05 versus CRP only control group.
