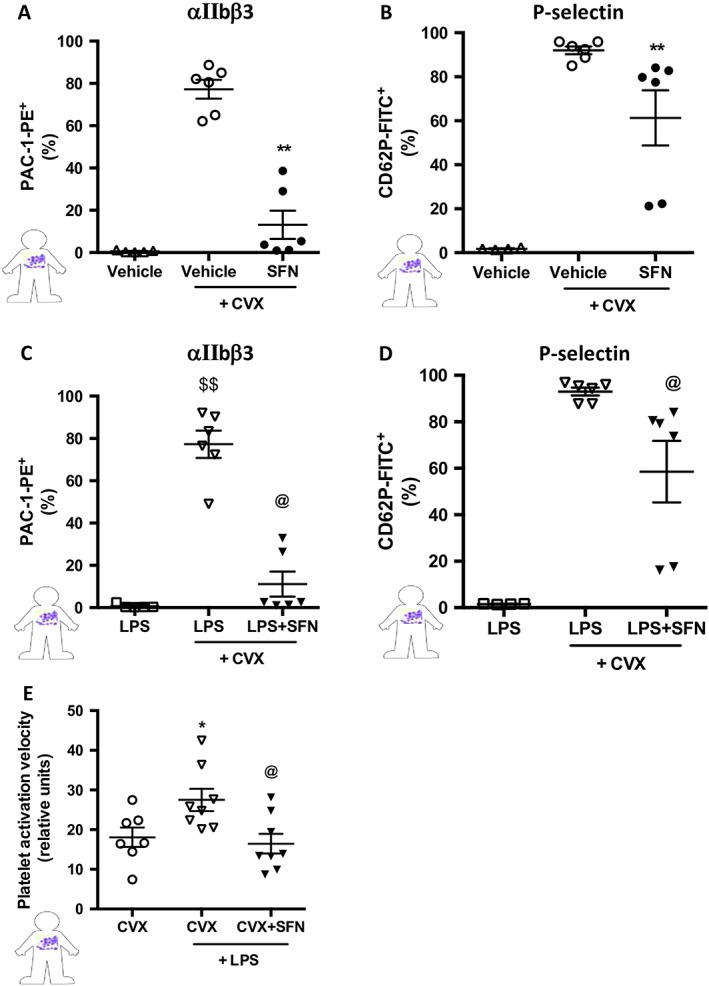
Figure 8.

Human platelet expression of cell surface receptors post CVX stimulation. Activated integrin αIIbβ3 and P‐selectin were quantified using flow cytometry in platelets following 15 min stimulation with the GPVI collagen receptor agonist CVX (1.7 ng). Vehicle or SFN treatment (60 μM) was given 30 min prior to activation, followed by vehicle (saline) or LPS (7.5 μg·mL−1 for 5 min). Mean fluorescence intensities of platelet (A and C) activated αIIbβ3 (GPIIbIIIa) and (B and D) P‐selectin. (E) Velocity of aggregate formation was measured using low angle light scattering technique for platelets stimulated by CVX, CVX + LPS or CVX + LPS + SFN (concentrations as above). Data are mean ± SEM of n = 5–6 mice per group [n = 4 for vehicle (P‐selectin) only and LPS (P‐selectin) only groups due to an outlier in each]. # P < 0.05 versus control (vehicle) only group. $ P < 0.05 versus LPS only group. ** P < 0.05 versus control (vehicle) and CVX group. @ P < 0.05 versus LPS and CVX group.
