
Figure 2.
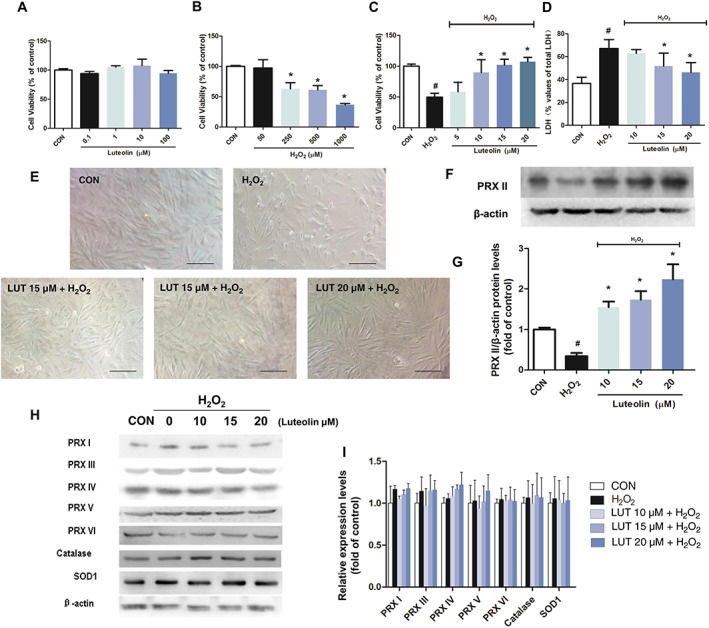
Luteolin prevented H2O2‐induced injury in H9c2 cardiomyocytes. Cardiomyocytes were treated with (A) luteolin (LUT) only (0.1–100 μM) for 24 h, or (B) increasing concentrations of H2O2 (50, 250, 500 and 1000 μM) for 2 h, and (C) luteolin (10–20 μM) followed by H2O2 (250 μM) for 2 h. Cell viability was measured using the MTT assay. (D) The release of LDH at the end of the incubation with H2O2 was determined. (E) Cell morphology was observed after 2 h of H2O2 exposure. Abnormal cell morphology was induced by H2O2, whereas pretreatment with luteolin resulted in dose‐dependent protection from the H2O2‐induced morphological changes (×200, bar = 100 μm). Effects of luteolin on the protein levels of the peroxiredoxins (PRX), catalase and SOD1 in H2O2‐exposed H9c2 cells (F–I). Cells were cultured in six‐well plates until confluent, and the medium was replaced with serum‐free medium, with or without luteolin (10, 15 and 20 μM) for 2 h. The cells were then stimulated with 250 μM H2O2 for 2 h. Results were expressed as percentages of the control values (CON). Data shown are means ± SD for five independent experiments. Data in (G) and (I) were normalized against levels of β‐actin, which was used as a loading control. For calculation of relative changes in protein expression, values of individual samples were divided by the mean value of samples from the control group. Microscopic images are representative of five independent experiments. H2O2, simulated H2O2‐treated only. # P < 0.05, significantly different from control; *P < 0.05, significantly different from H2O2.